What Are Electrostatic Potential Maps and Their Significance?
TL;DR
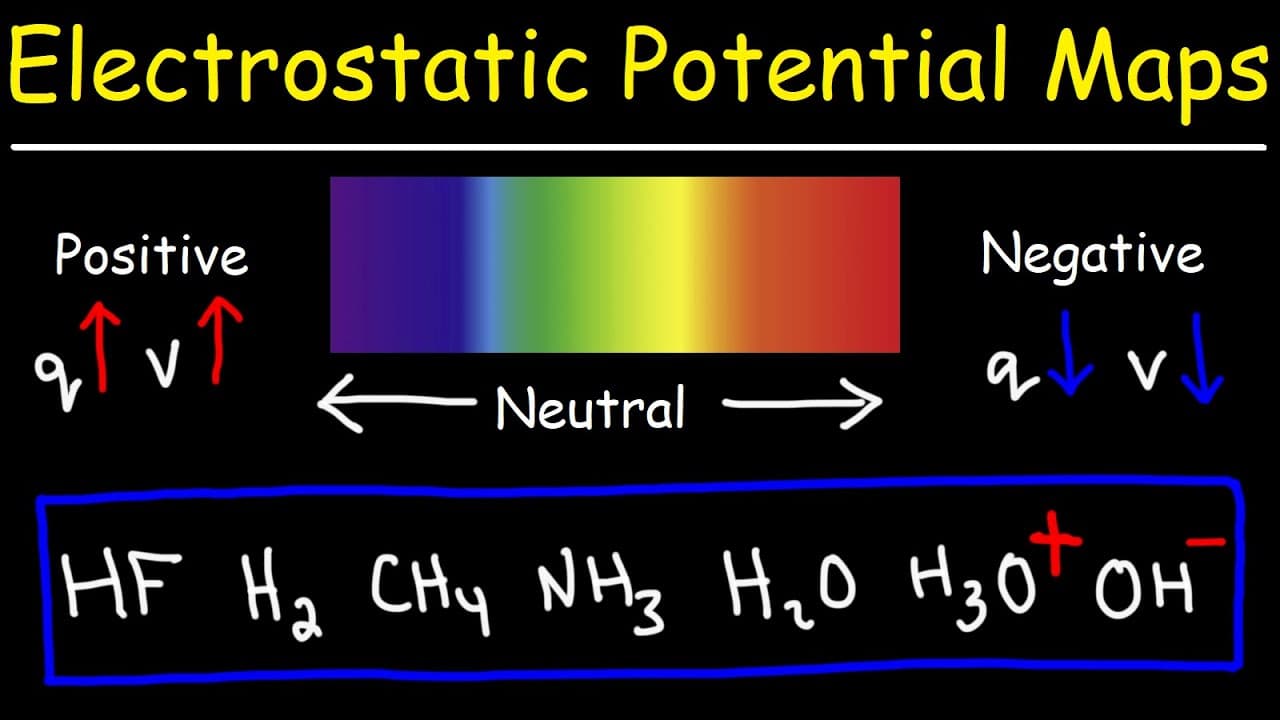
Electrostatic potential maps visually represent electric charge distribution in molecules, with red areas indicating negative charge and blue areas indicating positive charge. They help differentiate polar from non-polar molecules based on color variations, as well as demonstrate how electron density correlates with electric potential, which is crucial for understanding molecular reactivity in organic chemistry.
Transcript
in this lesson we're going to talk about electrostatic potential Maps now you're most likely to encounter this topic either in your first or second chapter of organic chemistry now you might be wondering what is an electrostatic potential map well let's think about the words electrostatic I think of static electricity static means stationary in thi... Read More
Key Insights
- 🍁 Electrostatic potential maps show the distribution of electric charge in molecules, helping visualize the polarity of different regions.
- ❎ The color coding in electrostatic potential maps follows the visible spectrum, with red indicating negative charge and blue indicating positive charge.
- 😥 The potential difference between two points in a molecule represents the difference in electric potential or voltage.
- 🔆 The charge density or electron density increases as we move towards the right side of the electrostatic potential map, indicating regions with more electrons and higher negative charge.
- 🥺 In polar molecules, there is a significant difference in electronegativity between the atoms, leading to different colors in the electrostatic potential map.
- 🐻❄️ Non-polar molecules have a uniform color in the electrostatic potential map, indicating an equal distribution of charge.
- 🍁 Electrostatic potential maps can be helpful in identifying and understanding the reactivity of molecules in organic chemistry.
Install to Summarize YouTube Videos and Get Transcripts
Explore YouTube Video Summarizer or Get YouTube Transcript Extractor
Questions & Answers
Q: What is an electrostatic potential map and what does it show?
An electrostatic potential map illustrates how electric charge is distributed among a molecule. It shows regions of positive and negative charge, with red indicating negative charge and blue indicating positive charge.
Q: How does the electric potential in a molecule relate to its charge?
The electric potential in a molecule is directly related to its charge. As the charge increases, the electric potential also increases. This relationship is similar to the concept of voltage in physics.
Q: What is the significance of the color coding in electrostatic potential maps?
The color coding in electrostatic potential maps follows the visible spectrum, with red-orange representing regions of negative charge and blue representing regions of positive charge. It helps visualize the distribution of charge in the molecule.
Q: How can electrostatic potential maps be used in organic chemistry?
Electrostatic potential maps can be used to analyze the charge distribution in organic molecules. They help identify polar and non-polar regions, as well as positively and negatively charged regions, which can be useful in understanding the reactivity and behavior of the molecule.
Summary & Key Takeaways
-
Electrostatic potential maps illustrate the distribution of electric charge in molecules, with red indicating regions of negative charge and blue indicating regions of positive charge.
-
The color coding of electrostatic potential maps follows the visible spectrum, with red-orange representing negatively charged regions and blue representing positively charged regions.
-
The potential difference between two points in a molecule is analogous to voltage in physics, and it increases as the electric charge increases.
Read in Other Languages (beta)
Share This Summary 📚
Summarize YouTube Videos and Get Video Transcripts with 1-Click
Try YouTube Summary with ChatGPT & Claude or YouTube Transcript Generator
Explore More Summaries from The Organic Chemistry Tutor 📚




Summarize YouTube Videos and Get Video Transcripts with 1-Click
Try YouTube Summary with ChatGPT & Claude or YouTube Transcript Generator