2025 Lecture Series: How to Analyze the ICT Gauntlet and NQ AM Session, May 07, 2025 Review
TL;DR
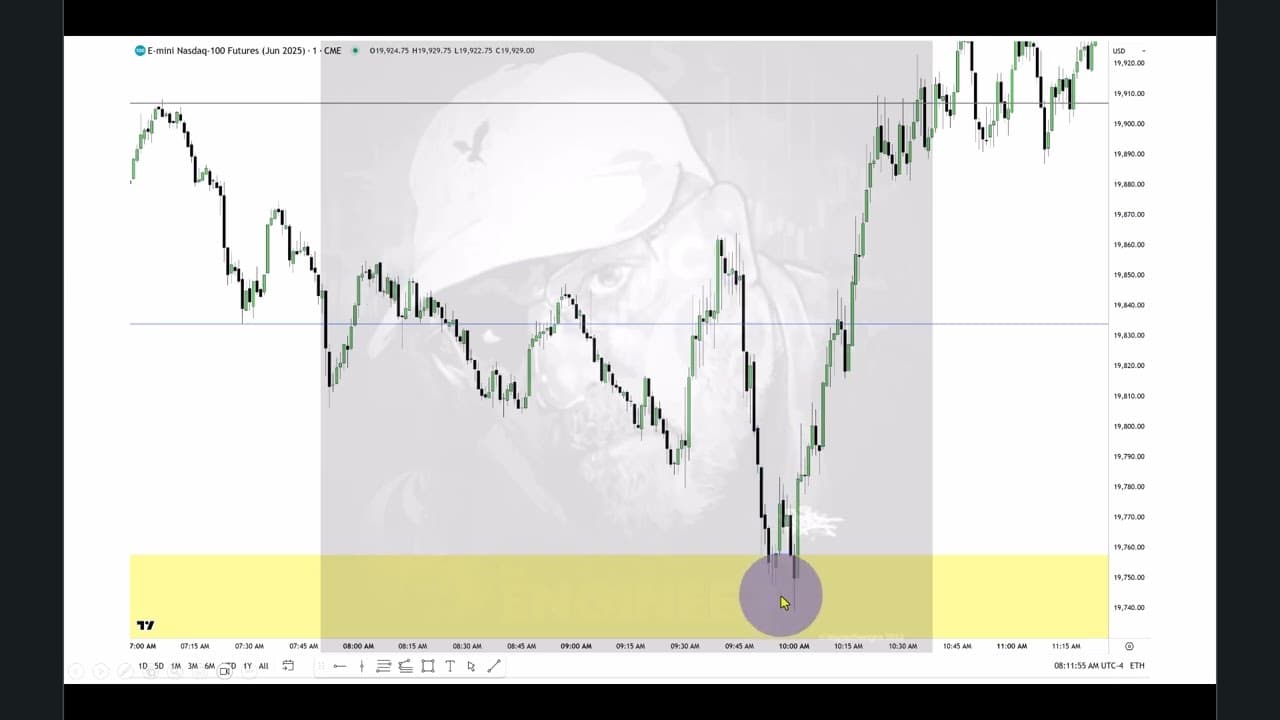
The May 07, 2025 NQ AM session is analyzed by tracking liquidity, a market maker sell model, fair value gaps, and five levels from Thursday’s daily premium wick. The review moves from the NASDAQ daily chart to a one-minute chart, then examines liquidity taken at 9:30 and the expected draw toward relative equal highs. Read on for the specific structures and levels used to form that narrative.
Transcript
My folks, good morning. Uh the review on Monday and Tuesday of this week. Here's the NASDAQ daily chart for June delivery. And I mentioned that we were to be following the levels in this Thursday's premium wick. So it's high, upper quadrant, mid croch level, lower quadrant, and the open of the candlestick, which is the full range of five levels tha... Read More
Key Insights
- Understanding liquidity pools is crucial for market analysis.
- Market maker sell models indicate shifts in market structure.
- Fair value gaps are critical for identifying trading opportunities.
- The ICT Gauntlet is a specific fair value gap within a bullish breaker.
- Precision in trading comes from recognizing specific price levels.
- The use of time frames like 15-second charts can clarify market movements.
- The silver bullet concept involves buy-side and sell-side inefficiencies.
- Algorithmic price delivery signatures reveal market control.
Install to Summarize YouTube Videos and Get Transcripts
Explore YouTube Video Summarizer or Get YouTube Transcript Extractor
Questions & Answers
Q: How does the May 07, 2025 ICT NQ AM session review analyze market structure?
The review begins with the NASDAQ daily chart for June delivery and carries forward five levels from Thursday’s premium wick. It then moves to a one-minute chart to identify a market maker sell model, a market-structure shift, redistribution, fair value gaps, and liquidity targets.
Q: Which five levels make up Thursday’s daily premium wick?
The five levels are the wick high, upper quadrant, consequent encroachment level, lower quadrant, and the candlestick open. The presenter carries these levels forward to navigate subsequent price action.
Q: What market maker sell model appears on the one-minute chart?
Price begins near relative equal lows, trades progressively higher, and then breaks aggressively lower. The presenter identifies a market-structure shift followed by distribution and second-stage redistribution, which produces the most powerful leg lower.
Q: Why is the second-stage redistribution important in this review?
The second-stage redistribution aligns with the high of Thursday’s daily wick and precedes a strong decline. The presenter describes it as the most powerful leg of the market maker sell model.
Q: How is the daily bullish fair value gap used in the analysis?
The yellow daily bullish fair value gap supports the working draw on price. The idea would be negated if price traded and closed below that gap.
Q: How are liquidity pools identified during the NQ morning session?
The presenter watches the range beginning at 7:00 a.m. Eastern time and treats its high and the shorter-term highs as potential liquidity raids. These levels can attract price whether the market ultimately moves higher or lower that day.
Q: What happened to liquidity at 9:30 in the reviewed session?
At 9:30, the market opened, traded lower, and took liquidity beneath relative equal lows and another short-term low. From that action, the presenter expected price to draw upward and at least clear the nearby relative equal highs before potentially trading back down.
Q: What is the difference between narrative and bias in this analysis?
The presenter treats narrative as the logic used to interpret likely price draws and market behavior, rather than relying only on a directional predisposition. In this session, that narrative combined the daily bullish fair value gap, the 9:30 liquidity sweep, and the relative equal highs above price.
Summary & Key Takeaways
-
The video explores the ICT Gauntlet and its application in market analysis, emphasizing the importance of liquidity pools and market maker sell models in identifying trading opportunities. It highlights the use of fair value gaps and specific time frames to enhance trading precision.
-
The presenter discusses the significance of understanding narrative versus bias and the role of algorithmic price delivery in market movements. Key concepts include the silver bullet and the gauntlet, which aid in recognizing trading patterns.
-
The analysis underscores the need for precision and understanding specific market structures to optimize trading strategies. The discussion includes the use of 15-second charts and the identification of buy-side and sell-side inefficiencies.
Read in Other Languages (beta)
Share This Summary 📚
Summarize YouTube Videos and Get Video Transcripts with 1-Click
Try YouTube Summary with ChatGPT & Claude or YouTube Transcript Generator
Explore More Summaries from The Inner Circle Trader 📚



Summarize YouTube Videos and Get Video Transcripts with 1-Click
Try YouTube Summary with ChatGPT & Claude or YouTube Transcript Generator