How to Learn Statistics for Data Science
TL;DR
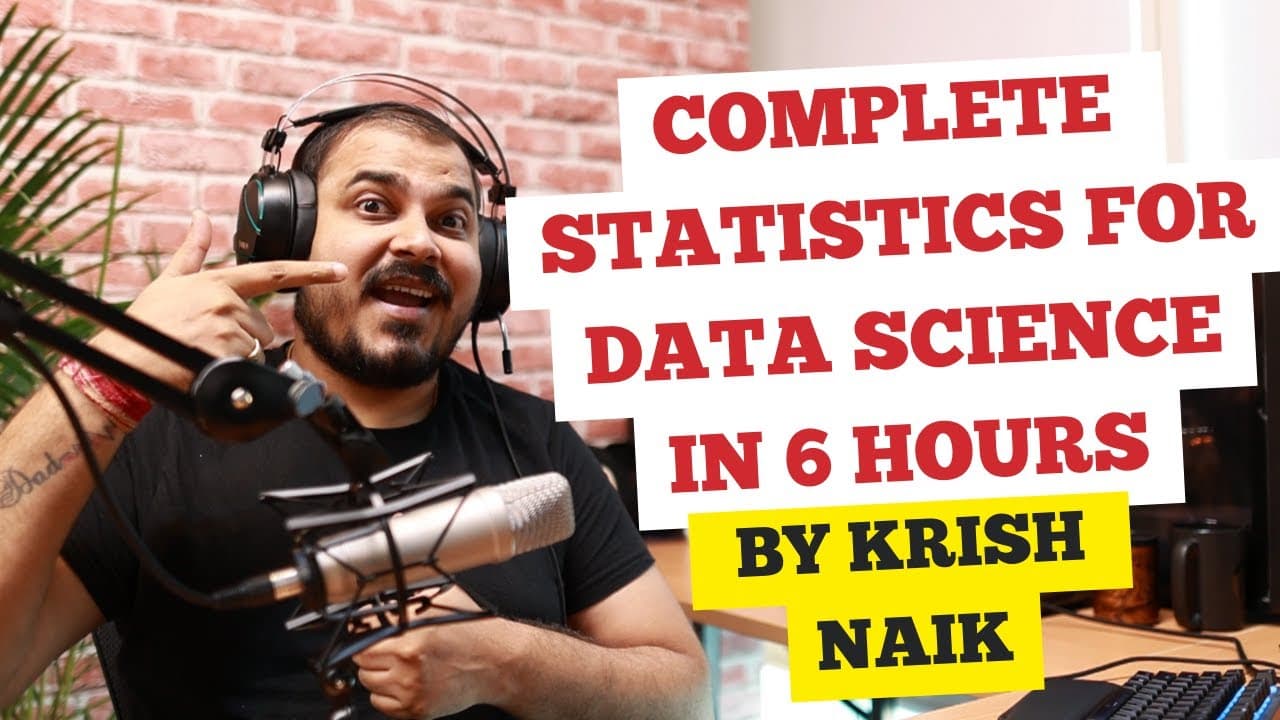
Statistics supports better decision-making by collecting, organizing, analyzing, interpreting, and presenting measurable data. A practical data science foundation combines descriptive statistics for summarizing observations with inferential statistics for drawing conclusions from samples, supported by probability, distributions, sampling, hypothesis testing, confidence intervals, correlation, outlier detection, and Python-based analysis.
Transcript
hello guys what are we basically going to cover from basics to advanced uh this will be specifically related to positions like data scientist data analyst related to business intelligence tool everything will get covered over here we need to understand the basic differences between descriptive statistics and second one is inferential stats the diff... Read More
Key Insights
- Statistics is the science of collecting, organizing, and analyzing measurable data to support better decisions. Its value in data science comes from turning large amounts of generated information into summaries, conclusions, and evidence that can contribute to product improvements and business goals.
- Descriptive statistics consists of organizing and summarizing data. It includes measures of central tendency and dispersion, along with histograms, boxplots, percentiles, quartiles, five-number summaries, probability density functions, and cumulative distribution functions that describe the observations available for analysis.
- Inferential statistics uses measured data to form conclusions. A sample, such as one mathematics classroom, can be analyzed to investigate whether its marks are similar to those of the larger population represented by all mathematics classrooms in the college.
- Data is composed of facts or pieces of information that can be measured. Examples in the lesson include student IQ values, ages, and examination marks, all of which can be recorded and analyzed using appropriate descriptive or inferential statistical techniques.
- Sampling is necessary when collecting information from every member of a population is impractical. The election exit-poll example illustrates why reporters may question part of a state population and use that sample as the available evidence for examining the broader population.
- Measures of central tendency and dispersion describe different properties of data. Mean, median, and mode characterize central values, while variance and standard deviation describe spread, with percentiles, quartiles, and boxplots providing additional ways to summarize distributions and identify outliers.
- Hypothesis testing requires defining null and alternative hypotheses and interpreting p-values, significance values, confidence intervals, and possible errors. The course connects these ideas to one-sample z-tests, one-sample t-tests, chi-square tests, ANOVA, and the statistical tables used to obtain relevant values.
- Distribution analysis includes Gaussian, standard normal, log-normal, binomial, Bernoulli, Pareto, and other distributions. Transformations, standardization, and Q-Q plots are presented as techniques for working with distributions and determining whether observed data follows a normal distribution.
Install to Summarize YouTube Videos and Get Transcripts
Explore YouTube Video Summarizer or Get YouTube Transcript Extractor
Questions & Answers
Q: What is statistics in data science?
Statistics is the science of collecting, organizing, and analyzing data, with interpretation and presentation also included in the description. Data consists of measurable facts or pieces of information, such as student IQ values, ages, or examination marks. In data science, statistical methods help summarize large amounts of generated data, form conclusions, and support better decisions related to products and business goals.
Q: What is the difference between descriptive and inferential statistics?
Descriptive statistics organizes and summarizes the data that has been observed, using tools such as averages, standard deviation, histograms, and boxplots. Inferential statistics uses measured data to form conclusions about a broader group. For example, marks from one mathematics classroom can be summarized descriptively, then treated as a sample when investigating marks across all mathematics classrooms in a college.
Q: What are a population and a sample in statistics?
A population is the complete group that a statistical question concerns, while a sample is the smaller measured group used to examine that population. In the classroom example, all mathematics classrooms in a college form the population, while one classroom provides the sample. The exit-poll example similarly shows why reporters question only part of a state population when asking every person is impractical.
Q: How are mean, median, mode, variance, and standard deviation used?
Mean, median, and mode are measures of central tendency used to summarize where values are centered. Variance and standard deviation are measures of dispersion used to describe how values are spread. The course places these methods within descriptive statistics and combines them with percentiles, quartiles, five-number summaries, histograms, and boxplots to organize and summarize a dataset from several perspectives.
Q: How can a normal distribution be evaluated?
Normality can be studied by examining Gaussian and standard normal distributions and applying techniques such as transformations, standardization, and Q-Q plots. The course specifically uses Q-Q plots to help determine whether a distribution is normal. It also discusses probability density functions and cumulative distribution functions, providing additional ways to represent and examine how values are distributed.
Q: What does hypothesis testing involve?
Hypothesis testing involves defining a null hypothesis and an alternative hypothesis, then evaluating evidence through p-values, significance values, and confidence intervals. The course also discusses Type 1 and Type 2 errors and shows how hypothesis-testing ideas connect to one-sample z-tests, one-sample t-tests, chi-square tests, ANOVA, and statistical reference tables such as z, t, and chi-square tables.
Q: Which statistical tests are covered for inferential analysis?
The inferential statistics section covers z-tests, t-tests, chi-square tests, and ANOVA, which is also described as an F-test. It includes one-sample z-tests and one-sample t-tests, discusses different ways to perform a z-test, and mentions factorial and other kinds of ANOVA. Python is used to execute several of these inferential procedures and demonstrate their application.
Q: What probability and correlation topics support data science statistics?
The probability section covers probability itself, additive and multiplicative rules, permutations, and combinations. The later analysis covers covariance, Pearson correlation, and Spearman rank correlation. Together with distributions, sampling, p-values, significance values, and hypothesis tests, these topics provide methods for reasoning about possible outcomes, associations between variables, and conclusions drawn from measured data.
Summary & Key Takeaways
-
Statistics is introduced as the science of collecting, organizing, and analyzing measurable facts or information for better decision-making. The course divides the subject into descriptive and inferential statistics, then connects these branches to data science, data analysis, business intelligence, interviews, product improvement, and the interpretation of large amounts of generated data.
-
Descriptive statistics organizes and summarizes observed data through mean, median, mode, variance, standard deviation, percentiles, quartiles, five-number summaries, histograms, and boxplots. The course also covers variables, measurement scales, probability density functions, cumulative distribution functions, Gaussian and standard normal distributions, transformations, standardization, Q-Q plots, and Python-based outlier detection.
-
Inferential statistics uses measured sample data to form conclusions about a larger population. The lessons cover sampling techniques, probability, permutations and combinations, null and alternative hypotheses, p-values, significance values, confidence intervals, Type 1 and Type 2 errors, z-tests, t-tests, chi-square tests, ANOVA, covariance, Pearson correlation, Spearman rank correlation, and Python execution.
Read in Other Languages (beta)
Share This Summary 📚
Summarize YouTube Videos and Get Video Transcripts with 1-Click
Try YouTube Summary with ChatGPT & Claude or YouTube Transcript Generator
Explore More Summaries from Krish Naik 📚





Summarize YouTube Videos and Get Video Transcripts with 1-Click
Try YouTube Summary with ChatGPT & Claude or YouTube Transcript Generator