Products
Features
YouTube Video Summarizer
Summarize YouTube videos
Web & PDF Highlighter
Highlight web pages & PDFs
Chat with PDF
Ask any PDF questions with AI
Ask AI Clone
Chat with your highlights & memories
Audio Transcriber
Transcribe audio files to text
Glasp Reader
Read and highlight articles
Kindle Highlight Export
Export your Kindle highlights
Idea Hatch
Hatch ideas from your highlights
Integrations
Obsidian Plugin
Notion Integration
Pocket Integration
Instapaper Integration
Medium Integration
Readwise Integration
Snipd Integration
Hypothesis Integration
Apps & Extensions
Chrome Extension
Safari Extension
Edge Add-ons
Firefox Add-ons
iOS App
Android App
Discover
Discover
Ideas
Discover new ideas and insights
Articles
Curated articles and insights
Books
Book recommendations by great minds
Posts
Essays and notes from readers
Quotes
Inspiring quotes collection
Videos
Curated videos and summaries
Explore Glasp
Glasp Story
How we grew from 0 to 3 million users
Glasp Newsletter
Weekly insights and updates
Glasp Talk
Interview series with great minds
Glasp Blog
Latest news and articles
Glasp Use Cases
Learn how others use Glasp
Build & Support
Glasp API
Access Glasp's API for developers
MCP Connector
Connect Glasp to Claude & ChatGPT
Community
Glasp Reddit Community
Students
Student discount and benefits
FAQs
Frequently Asked Questions
AboutPricing
DashboardLog inSign up

Using a Macro in LabChart to calculate RR intervals and Heart Rate Variability (HRV)

12.6K views
•
March 25, 2014
by
Dory Video
YouTube video player
Using a Macro in LabChart to calculate RR intervals and Heart Rate Variability (HRV)

TL;DR

Learn how to automate repetitive data analysis tasks using macros in Lab Chart.

Transcript

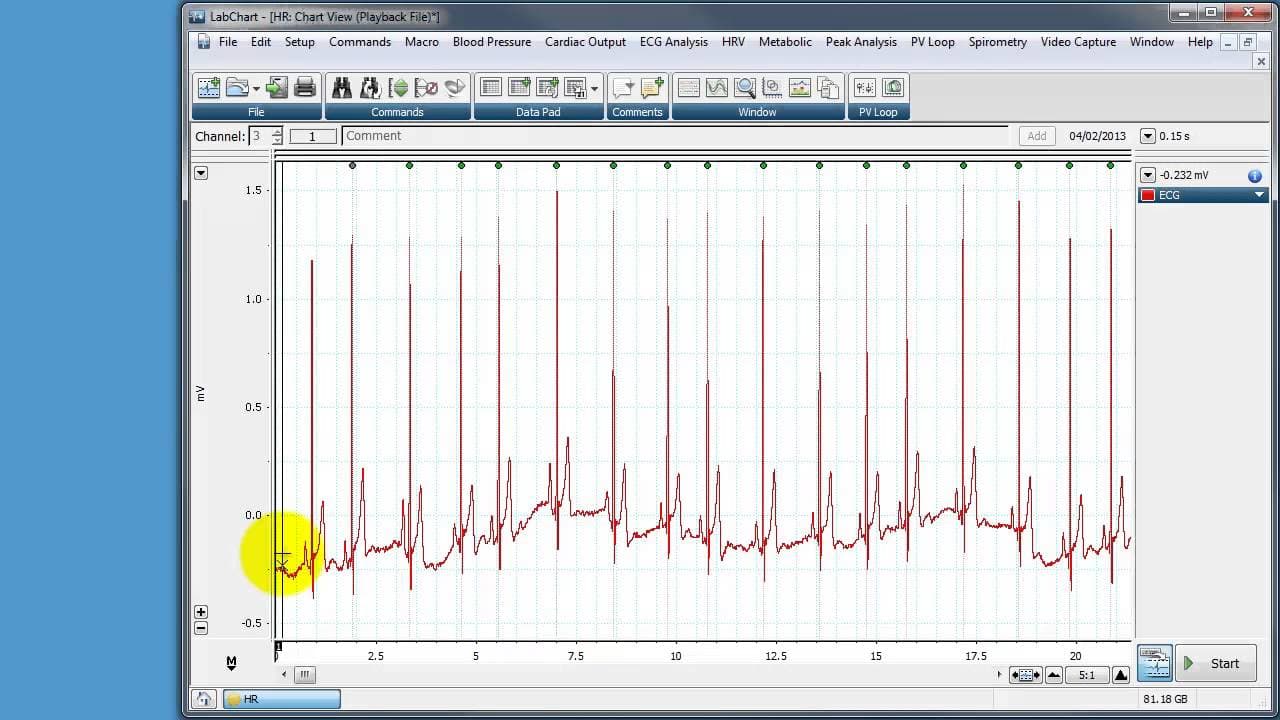
hello this is a quick demonstration of how to use a macro in lab chart in order to automate what would be a rather laborious repetitive job for instance here I've got an ECG recording and the ECG recording is around 10 minutes long it's recorded on a subject Lim Le to at rest and you can see we've got a a lot of pqrst complexes here um let's ask a ... Read More

Key Insights

  • 🥼 Macros in Lab Chart are a powerful tool for automating repetitive data analysis tasks.
  • 😟 The example demonstrated in the content shows how macros can be used to measure RR interval variability in an ECG recording.
  • 👻 Macros allow users to find peaks, measure intervals, and add them to the data pad automatically.
  • 👤 By using macros, users can save time and effort in data analysis tasks.
  • 👤 Macros can be customized to perform specific actions based on the user's requirements.
  • 😒 Saving macros in template files enables their use in future recordings and analyses.
  • 👤 Lab Chart's macro functionality provides a user-friendly interface and simplifies programming tasks.

Install to Summarize YouTube Videos and Get Transcripts

Explore YouTube Video Summarizer or Get YouTube Transcript Extractor

Questions & Answers

Q: What is the purpose of using macros in Lab Chart?

Macros in Lab Chart are used to automate repetitive tasks in data analysis, saving time and effort. They allow users to create customized commands to perform specific actions automatically.

Q: How can macros be used to measure RR interval variability in an ECG recording?

By using macros, users can find the peaks of the R waves in the ECG recording, measure the time between them, and add the intervals to the data pad. This process can be repeated for the entire recording, resulting in a list of RR intervals.

Q: Can macros in Lab Chart be used for other types of data analysis?

Yes, macros can be used for various types of data analysis in Lab Chart. They allow users to create customized commands and automate repetitive tasks, making data analysis more efficient.

Q: How can macros be saved and used for future analyses?

Macros are saved within the Lab Chart file. To use a macro for future analyses, it can be saved in a template file or the current file can be saved as a template. This allows the macro to be accessible for analysis in future recordings.

Summary & Key Takeaways

  • This content demonstrates the use of macros in Lab Chart to automate repetitive tasks in data analysis.

  • The example used is analyzing the RR interval variability in an ECG recording.

  • The process involves finding the peaks of the R waves, measuring the time between them, and adding it to the data pad using macros.


Read in Other Languages (beta)

English

Share This Summary 📚

Summarize YouTube Videos and Get Video Transcripts with 1-Click

Download browser extensions on:

Try YouTube Summary with ChatGPT & Claude or YouTube Transcript Generator

Explore More Summaries from Dory Video 📚

Playing Vienna Instruments (VSL) with a ROLI Seaboard RISE thumbnail
Playing Vienna Instruments (VSL) with a ROLI Seaboard RISE
Dory Video
How to Set Up Multi-Instrument Layers in Kontakt 5 thumbnail
How to Set Up Multi-Instrument Layers in Kontakt 5
Dory Video
Roland Cloud Anthology 1987 - Sampled D50 LA synth thumbnail
Roland Cloud Anthology 1987 - Sampled D50 LA synth
Dory Video
How to Perform Linear Regression in GraphPad Prism thumbnail
How to Perform Linear Regression in GraphPad Prism
Dory Video
WavesFactory MERCURY Piano for Kontakt thumbnail
WavesFactory MERCURY Piano for Kontakt
Dory Video
What Are UVI Workstation String Machines and Their Features? thumbnail
What Are UVI Workstation String Machines and Their Features?
Dory Video

Summarize YouTube Videos and Get Video Transcripts with 1-Click

Download browser extensions on:

Try YouTube Summary with ChatGPT & Claude or YouTube Transcript Generator

Apps & Extensions

  • Chrome Extension
  • Safari Extension
  • Edge Add-ons
  • Firefox Add-ons
  • iOS App
  • Android App

Key Features

  • YouTube Video Summarizer
  • Web & PDF Summarizer
  • Web & PDF Highlighter
  • Chat with PDF
  • Ask AI Clone
  • Audio Transcriber
  • Glasp Reader
  • Kindle Highlight Export
  • Idea Hatch

Integrations

  • Obsidian Plugin
  • Notion Integration
  • Pocket Integration
  • Instapaper Integration
  • Medium Integration
  • Readwise Integration
  • Snipd Integration
  • Hypothesis Integration

More Features

  • APIs
  • MCP Connector
  • Blog & Post
  • Embed Links
  • Image Highlight
  • Personality Test
  • Quote Shots
  • Open Graph Checker

Company

  • About us
  • Our Story
  • Blog
  • Community
  • FAQs
  • Job Board
  • Newsletter
  • Pricing
Terms

•

Privacy

•

Guidelines

© 2026 Glasp Inc. All rights reserved.