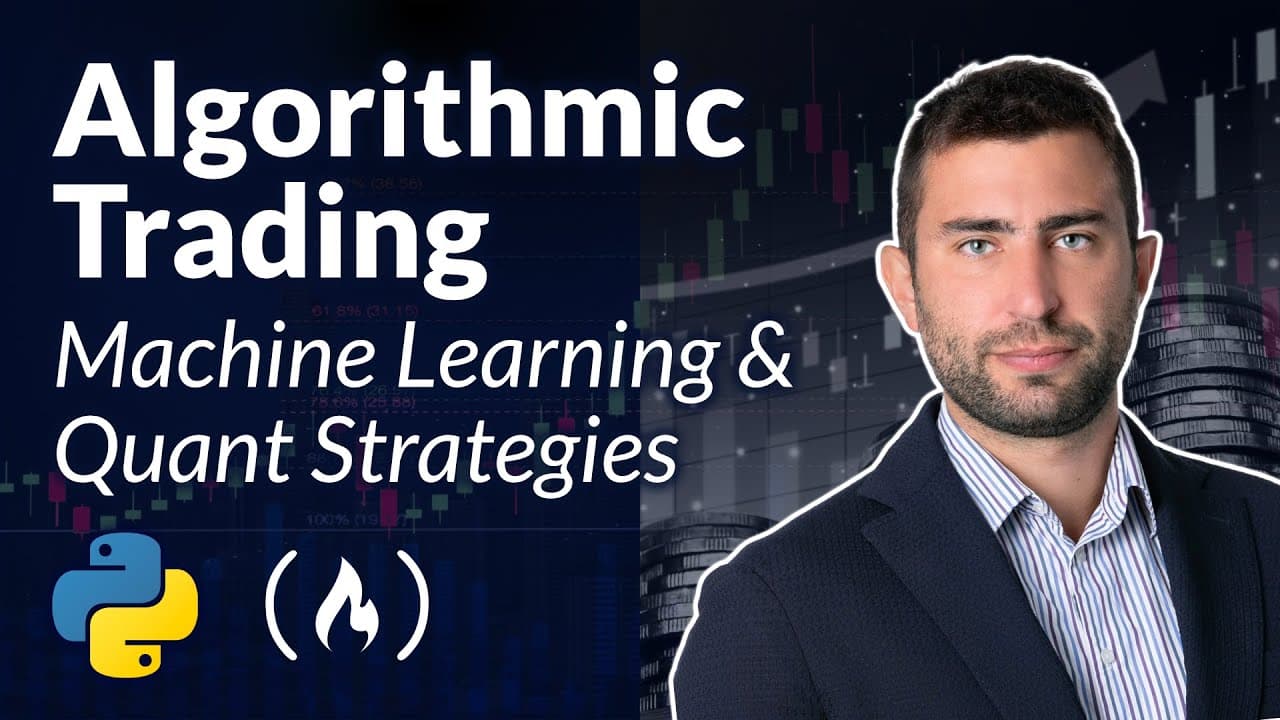
How Does Algorithmic Trading Work? Machine Learning and Quant Strategies Course with Python
TL;DR
Algorithmic trading uses predefined rules, coded in a programming language and run by a computer, to support manual or automated trading. This Python course develops three projects: an unsupervised-learning strategy for S&P 500 stocks, a Twitter sentiment strategy for NASDAQ 100 stocks, and an intraday GARCH volatility strategy using simulated data. Read on for the workflow, applications, and key machine-learning challenges.
Transcript
in this comprehensive course on algorithmic trading you will learn about three cuttingedge trading strategies to enhance your financial toolkit latchezar teaches this course he is an experienced quantitative researcher and data scientist in the first module you'll explore the unsupervised learning trading strategy utilizing SP 500 stocks data to ma... Read More
Key Insights
- Algorithmic trading is trading on a predefined set of rules combined into a strategy or system, developed in a programming language and run by the computer. It supports both manual execution (via screeners or alerts) and fully automated systems that calculate positions and execute trades.
- Python is the most popular language in algorithmic trading, quantitative finance, and data science, mainly due to its vast libraries and ease of use. It handles data pipelines, research, and backtesting, but because it is slow it suits only low-complexity automation.
- High-complexity systems that must execute trades very quickly use Java or C++ instead of Python. Python remains best for research and automating low-complexity strategies rather than high-end, time-critical execution.
- Quantitative research is a strong career path, with an average yearly base salary around $173,000 for a quant researcher, not including the yearly bonus. Core skills include Python, backtesting, replicating papers, and machine learning in trading.
- The reflexivity feedback loop makes predictions hard: once a profitable pattern is discovered and traded, other market participants find and exploit it too, shifting the price behavior earlier until the strategy is arbitraged away.
- Predicting returns and prices is the hardest machine-learning task in trading, followed by predicting return direction and economic indicators like nonfarm payrolls. Predicting the volatility of an asset is comparatively straightforward.
- Technical machine-learning challenges include overfitting (learning training data too well and failing on test data), poor generalization, non-stationary training data, regime shifts, and black-box models that cannot be interpreted correctly.
- Survivorship bias occurs when a stock that dropped out of the S&P 500 for failing is missing from the current list. Using the most recent S&P 500 list introduces this bias, so strategies should ideally be backtested on survivorship-bias-free data.
Install to Summarize YouTube Videos and Get Transcripts
Explore YouTube Video Summarizer or Get YouTube Transcript Extractor
Questions & Answers
Q: What is algorithmic trading?
Algorithmic trading uses a predefined set of rules combined into a strategy or system, developed in a programming language, and run by a computer. It can support manual trading through screeners or alerts, or automate calculations, position sizing, and trade execution.
Q: Why is Python used for algorithmic trading?
Python is widely used for algorithmic trading, quantitative finance, and data science because it is easy to use and has many libraries. It supports data pipelines, research, backtesting, and low-complexity automation, while high-end systems requiring very fast execution may use Java or C++.
Q: What three quantitative trading projects does the Python course build?
The course builds an unsupervised-learning strategy using S&P 500 stocks, a Twitter sentiment strategy using NASDAQ 100 stocks, and an intraday strategy for one asset using a GARCH model. The final project predicts volatility from simulated data and combines it with technical indicators.
Q: How does the unsupervised-learning trading strategy work?
The strategy downloads S&P 500 price data, calculates indicators and features, aggregates them monthly, and filters the 50 most liquid stocks. It adds returns across multiple horizons and rolling Fama-French factor betas, then uses K-means to group similar stocks before forming and rebalancing monthly portfolios.
Q: How can machine learning be used in trading?
Supervised learning can generate buy or sell signals by predicting an asset’s return or the direction of that return. It can also support risk management through position sizing, portfolio weights, or stop-loss predictions, while unsupervised learning can reveal patterns, relationships, structures, and clusters in market data.
Q: What is the reflexivity feedback loop in machine-learning trading?
The reflexivity feedback loop occurs when traders discover and exploit the same predicted market pattern, changing the price behavior that created the opportunity. If a strategy buys on Thursday before a predicted Friday rise, growing Thursday demand can move the increase earlier until the edge disappears.
Q: Which market predictions are hardest for machine learning?
Predicting asset returns and prices is described as the hardest task, followed by predicting whether returns will be positive or negative. Predicting economic indicators is also difficult, while predicting an asset’s volatility is comparatively more straightforward.
Q: What is survivorship bias in an S&P 500 backtest?
Survivorship bias arises when a backtest uses the current S&P 500 list and therefore excludes stocks that previously left the index after failing. This can distort results, so the strategy should ideally be tested with survivorship-bias-free data.
Summary & Key Takeaways
-
The course, taught by quantitative researcher and data scientist Lachezar, develops three quantitative projects from start to end using Python. It covers algorithmic trading basics, machine learning in trading, and the obstacles faced, before building each strategy. It is purely educational research, not financial advice, and no trades are automated or executed.
-
The first project is an unsupervised-learning strategy on S&P 500 stocks: download price data, calculate technical indicators and features, aggregate monthly, filter the top 50 most liquid stocks, add returns over multiple horizons, and compute rolling Fama-French factor betas. A K-means clustering model groups similar stocks into clusters.
-
From a selected cluster, monthly portfolios are formed with weights optimized via the efficient frontier max Sharpe ratio, held for one month, then rebalanced. Strategy returns are compared to the S&P 500. The other projects use Twitter sentiment on NASDAQ 100 stocks versus QQQ, and an intraday GARCH volatility strategy on simulated data.
Read in Other Languages (beta)
Share This Summary 📚
Summarize YouTube Videos and Get Video Transcripts with 1-Click
Try YouTube Summary with ChatGPT & Claude or YouTube Transcript Generator
Explore More Summaries from freeCodeCamp.org 📚
![The Most Important Skills Going Forward with CTO + Homebrew Maintainer Mike McQuaid [Podcast #204] thumbnail](/_next/image?url=https%3A%2F%2Fi.ytimg.com%2Fvi%2F58Tn2xB8kIE%2Fhqdefault.jpg&w=750&q=75)
Summarize YouTube Videos and Get Video Transcripts with 1-Click
Try YouTube Summary with ChatGPT & Claude or YouTube Transcript Generator