Why Is Bitcoin Losing Bull Market Support?
TL;DR
Bitcoin must recover above $100,000, then challenge $108,000, $112,000, and ideally $116,000, to improve its weakening structure. Falling buying strength, persistent outflows, rising stablecoin dominance, MicroStrategy’s decline, and the cycle’s 36-month age all favor a bearish interpretation, although fading sell volume near $97,900 could support a temporary reversal or lower swing top.
Transcript
On a day like today, no one wants to see these charts. Everything is down. Bitcoin is down. Favorite cryptocurrencies are down. The stock markets are down. And that's the S&P, the NASDAQ, and the Dow Jones after they put in all-time highs. Gold is down. Silver is down from a new all-time high as well, which was a weaker rally. The US dollar is also... Read More
Key Insights
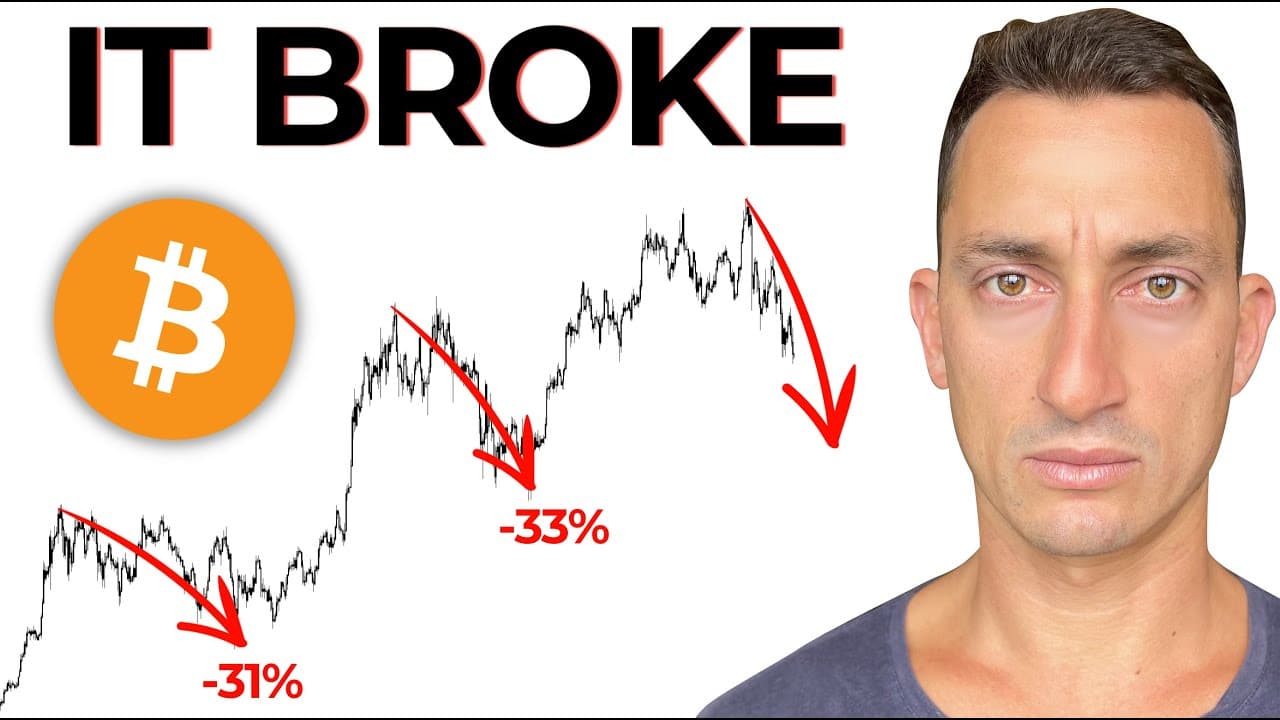
- Bitcoin is 22.5% below its high and has broken the 50% level near $100,000, although the weekly candle has not closed. A recovery before the end of the week could preserve some bullish hope, while continued weakness would confirm greater structural damage.
- The $97,900 low is a possible short-term reversal point if buyers can defend it. A successful hold could create a minor trend change, but the preceding rallies were weak, so any rebound must demonstrate substantially better strength before being treated as durable.
- Selling volume is declining across some successive new lows, which may indicate that downward momentum is slowing. However, that volume remains above buying volume on positive days, so the available evidence does not yet support a major bullish trend reversal.
- The key recovery levels are $100,000, $108,000, approximately $112,000, and ideally $116,000. The $108,000 area marks an important swing top, while $116,000 corresponds to the breakdown bar that Bitcoin has not come close to retesting.
- Bitcoin ETF flows are treated as a contrarian indicator because some of the largest buying volumes occurred near the market top. Continued outflows, combined with insufficient new buying, suggest that liquidity has not returned strongly enough to reverse the established selling trend.
- Bitcoin is underperforming the S&P 500, Nasdaq, and Dow Jones after those markets reached new all-time highs. If Bitcoin remains weak while stocks rally, a later Bitcoin rebound may only retest former structural support after it has become resistance.
- MicroStrategy is showing repeated macro lower highs and a continuing collapse after its final all-time high associated with excitement in July. A similar decline occurred near the end of the previous Bitcoin cycle, adding another warning sign to the current market structure.
- Stablecoin dominance is rising as liquidity moves toward USDT and USDC instead of returning to Bitcoin and other cryptocurrencies. USDT dominance has potential upside near 5.6%, while combined stablecoin dominance is approaching resistance around 8.2% to 8.5%, with 9% identified as the 50% level.
Install to Summarize YouTube Videos and Get Transcripts
Explore YouTube Video Summarizer or Get YouTube Transcript Extractor
Questions & Answers
Q: What price levels must Bitcoin recover to improve its trend?
Bitcoin first needs to recover above the 50% level near $100,000. The next important area is $108,000, which marks the swing top where the market broke down. With the range recalculated from the new low, another 50% level appears near $112,000. Ideally, Bitcoin would also move above the $116,000 breakdown bar to demonstrate a more convincing recovery.
Q: Can the $97,900 Bitcoin low produce a reversal?
The low around $97,900 could produce a minor change in trend if it holds and price reverses from that area. Declining volume across successive lows offers limited encouragement because selling pressure may be slowing. However, prior rebounds were weak, and selling volume still exceeds buying volume, so a durable reversal requires stronger buying and recovery through several overhead levels.
Q: Why does declining sell volume not confirm a Bitcoin bottom?
Declining sell volume at successive new lows can indicate that the downward move is losing some force, but it does not confirm that buyers have taken control. The selling volume remains above the volume recorded on positive days. Without stronger buying volume and a recovery through important resistance, the pattern may only produce a temporary rebound or lower swing top.
Q: Why are Bitcoin ETF flows used as a contrarian indicator?
Bitcoin ETF flows are viewed as contrarian because some of the largest buying activity in Bitcoin ETF history occurred near the market top. The approach is to question the crowd when mass participation becomes unusually strong. Subsequent outflows and continued price weakness support that caution because the heavy buying did not create a sustained advance or restore a bullish trend.
Q: What does Bitcoin’s weakness relative to stock markets indicate?
Bitcoin remained weak while the S&P 500, Nasdaq, and Dow Jones advanced to new all-time highs and moved beyond their October 10 bars. That relative underperformance suggests demand for Bitcoin has been insufficient even during strength elsewhere. If Bitcoin breaks major support, a later rally may only test that former support as resistance rather than begin a lasting advance.
Q: Why is MicroStrategy’s price action a warning for Bitcoin?
MicroStrategy has formed macro lower highs throughout the cycle, apart from one move when Bitcoin topped in July, and it has continued to collapse since its final all-time high associated with strong excitement. The previous cycle showed a similar pattern near Bitcoin’s end. This does not stand alone as confirmation, but it adds to the collection of bearish signals.
Q: How does rising stablecoin dominance affect the crypto outlook?
Rising stablecoin dominance indicates that liquidity is moving toward USDT and USDC instead of returning to Bitcoin and other cryptocurrencies. USDT dominance has potential upside near 5.6%, while combined stablecoin dominance is approaching resistance around 8.2% to 8.5%. A breakout toward the 9% level would strengthen the warning that capital remains defensive and crypto demand is weak.
Q: Why does the cycle timeline suggest Bitcoin may be near a top?
Bitcoin reached prior cycle tops approximately 35 months after the relevant low in 2017 and 2021, while the 2013 top arrived after 37 months. The current cycle is in month 36. A new high in December would therefore require a major turnaround, beginning with closes above $100,000 and $108,000, followed by substantial buying volume at higher prices.
Summary & Key Takeaways
-
Bitcoin has fallen 22.5% from its high and moved below the 50% level near $100,000, but the weekly close remains undecided. A low around $97,900 could support a minor reversal. Any recovery would need to reclaim $100,000 and overcome resistance near $108,000, $112,000, and ideally $116,000.
-
Market strength and sentiment are deteriorating as selling persists without sufficient buying volume. Declining volume at successive lows may slow the fall, but selling volume remains greater than buying volume. Heavy Bitcoin ETF buying occurred near the top, while subsequent outflows and Bitcoin’s weakness against rising stock markets reinforce the bearish trend.
-
Several broader indicators resemble prior cycle endings. MicroStrategy has formed macro lower highs and continued collapsing, stablecoin dominance is rising, and Bitcoin is in month 36 after its cycle low. The expected path may involve declines, failed rallies, and perhaps a final unsuccessful attempt at a new high before further weakness.
Read in Other Languages (beta)
Share This Summary 📚
Summarize YouTube Videos and Get Video Transcripts with 1-Click
Try YouTube Summary with ChatGPT & Claude or YouTube Transcript Generator
Explore More Summaries from Jason Pizzino 📚






Summarize YouTube Videos and Get Video Transcripts with 1-Click
Try YouTube Summary with ChatGPT & Claude or YouTube Transcript Generator