Why Is Bitcoin Showing Bearish Volume Signals?
TL;DR
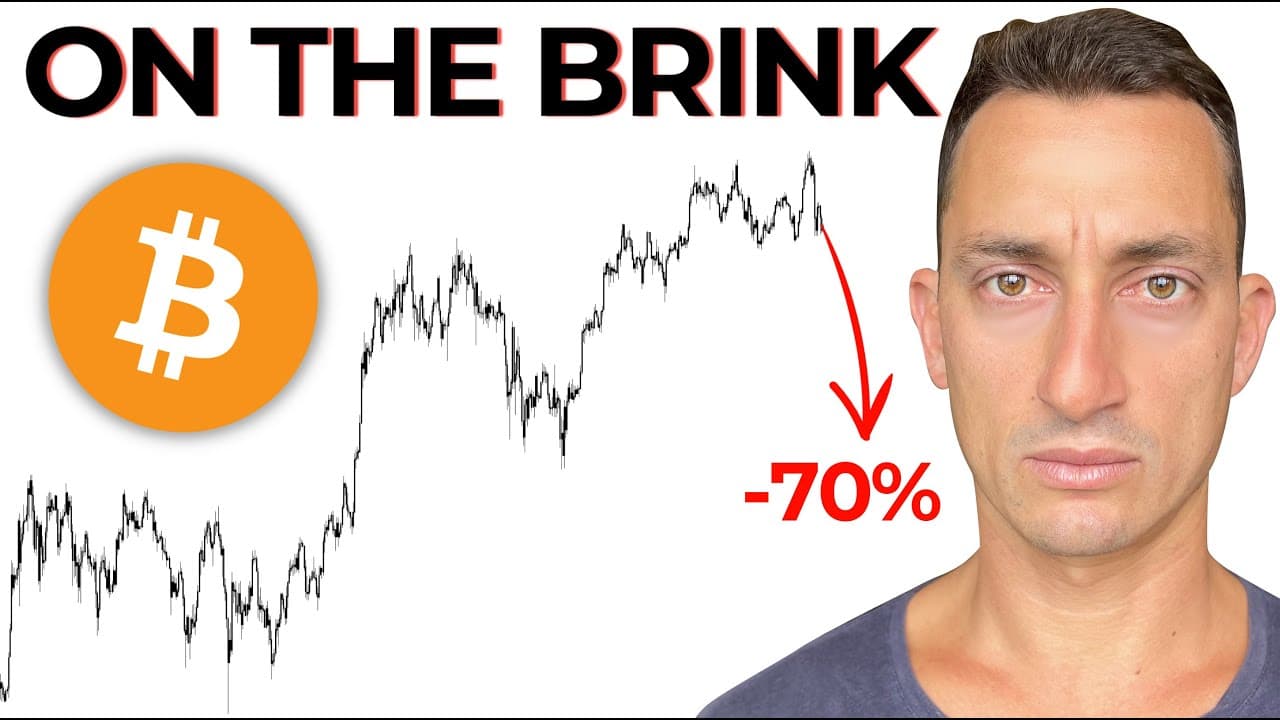
Bitcoin remains slightly bullish on price because it is holding above key 50% range levels, including roughly $100,000, but rising volume during recent declines signals growing selling pressure. The cycle is not confirmed over, yet weakening breakout volume, two high-volume down weeks, and MicroStrategy’s lower highs justify increased caution until price and volume provide clearer confirmation.
Transcript
For months now, we've been expecting a blowoff top scenario. It's been 10 months and Bitcoin is at the same price as it was at the peak in December of 2024. So, I've got a few questions I want to attempt to answer in today's video along with going through an update from last week's video. Huge numbers on that one there. nearly 70,000 views which me... Read More
Key Insights
- Bitcoin is still holding above a key 50% price level near $100,000 and above the previous swing low around $98,000. These levels keep the price structure slightly bullish for now, even as recent volume behavior creates reasons for caution.
- Declining average volume has persisted from November 2024 into October 2025. The presenter views this long-running contraction as evidence that buying participation has weakened while Bitcoin has struggled to make and sustain meaningful progress above previous highs.
- Strong volume is presented as confirmation for directional price moves. High volume accompanying a breakout supports bulls, while increasing volume during a breakdown favors bears, making the direction of price during high-volume periods more important than volume growth by itself.
- Recent selling is occurring with larger volume. The final week of September and early October closed near new all-time highs, but the following advance was limited, and the next two weekly declines showed increasing activity on the downside.
- Previous Bitcoin peaks showed weaker buying volume near marginal new highs. The presenter compares the current setup with 2021 and 2017, when price reached or slightly exceeded earlier highs without sufficiently strong volume before significant declines followed.
- Bitcoin-specific models have limited historical testing across only a few cycles. The presenter therefore prefers signals such as price, volume, and 50% range levels that can be examined across many markets rather than relying primarily on on-chain measures, halving-cycle models, or MVRV.
- MicroStrategy is showing relative weakness while Bitcoin has made higher highs. Its stock produced repeated lower highs, reached its lowest weekly close in six months near $290, and sat close to the full-cycle 50% level identified at $278.
- The crypto cycle is not confirmed over by the cited price ranges. Bitcoin has not broken its key 50% levels or the referenced moving averages, but a decisive loss of support combined with strong downside volume would add another bearish piece to the analysis.
Install to Summarize YouTube Videos and Get Transcripts
Explore YouTube Video Summarizer or Get YouTube Transcript Extractor
Questions & Answers
Q: Why is Bitcoin’s recent volume considered bearish?
Bitcoin’s recent volume is considered bearish because activity increased while price moved downward during the last two weekly bars discussed. The presenter says strong volume validates the direction of a move, so increasing volume during a breakdown benefits the bearish case. This follows a longer period in which average volume declined, suggesting weaker participation during attempts to advance above earlier highs.
Q: Is the Bitcoin market cycle confirmed to be over?
The Bitcoin cycle is not confirmed to be over according to the price-range analysis. Bitcoin remained above a key 50% level near $100,000, above the previous swing low around $98,000, and above the December 2024 top. Those supports preserve a slightly bullish price structure, although the growing volume on recent declines means the presenter believes greater caution is appropriate.
Q: What Bitcoin price levels are important in this analysis?
The analysis highlights a 50% range level near $100,000 and a previous swing low near $98,000. Bitcoin was still holding above both areas at the latest weekly close and also remained above the peak established in December 2024. The presenter uses these range midpoints as practical areas for entries and stops, similar to how other traders may use moving averages.
Q: How can volume confirm a Bitcoin breakout or breakdown?
Volume confirms a move when participation expands in the same direction as price. A breakout with strong volume is described as constructive for bulls because buying supports the move above resistance. A breakdown with strong volume favors bears because selling accompanies the loss of support. The current concern is that Bitcoin’s recent downside weeks showed increasing volume rather than renewed high-volume buying.
Q: How does the current Bitcoin setup compare with 2021?
The presenter compares the current setup with 2021 because both periods included a new or marginally higher all-time high with weaker follow-through. In 2021, substantial volume appeared near the first-half peaks, volume later declined, and price still reached another high before falling sharply. The current market similarly moved slightly higher after an early October close near new highs, then declined.
Q: Why does the presenter prefer price and volume over Bitcoin-specific models?
The presenter prefers price and volume because these signals can be back-tested across many markets and provide more historical data points. Bitcoin-specific measures such as on-chain analysis, halving-cycle models, and MVRV have only been tested across a small number of Bitcoin cycles. The concern is that a model that worked during earlier cycles may fail during the current or a future cycle.
Q: What does MicroStrategy’s chart signal about Bitcoin risk?
MicroStrategy’s chart is presented as an additional warning signal because the stock continued falling and formed lower highs while Bitcoin produced higher highs. It closed near $290, its lowest weekly close in six months, and approached the full-cycle 50% level at $278. The presenter says a break below $278 would not be a positive sign, with final lows around $233 also noted.
Q: What would make Bitcoin’s outlook more bullish again?
A more convincing bullish outlook would require stronger volume during a breakout, followed by price holding above the previous tops. The presenter says the current market has not demonstrated that combination because buying volume weakened while recent declines attracted greater activity. Continued support above the 50% range levels preserves upside potential, but stronger participation would be needed to validate another sustained advance.
Summary & Key Takeaways
-
Bitcoin returned to roughly the price of its December 2024 peak after 10 months, despite expectations for a blowoff top. The latest weekly close remained slightly bullish because price held above important 50% range levels, but declining average volume and stronger selling during recent down weeks made the overall setup increasingly precarious.
-
Volume is treated as a broadly tested market signal rather than a Bitcoin-specific model. Strong volume can validate either a bullish breakout or bearish breakdown. Coinbase data showed average volume declining from November 2024 into October 2025, while recent price declines attracted increasing volume, suggesting that sellers were becoming more active near the highs.
-
The analysis does not declare the crypto cycle finished because Bitcoin still holds above roughly $100,000, the prior $98,000 swing low, and the December 2024 top. However, MicroStrategy closed near $290, its lowest weekly close in six months, after sustained lower highs. Its $278 range midpoint became another important risk level.
Read in Other Languages (beta)
Share This Summary 📚
Summarize YouTube Videos and Get Video Transcripts with 1-Click
Try YouTube Summary with ChatGPT & Claude or YouTube Transcript Generator
Explore More Summaries from Jason Pizzino 📚






Summarize YouTube Videos and Get Video Transcripts with 1-Click
Try YouTube Summary with ChatGPT & Claude or YouTube Transcript Generator