How to Build an Arduino-Based Air Quality Monitor
TL;DR
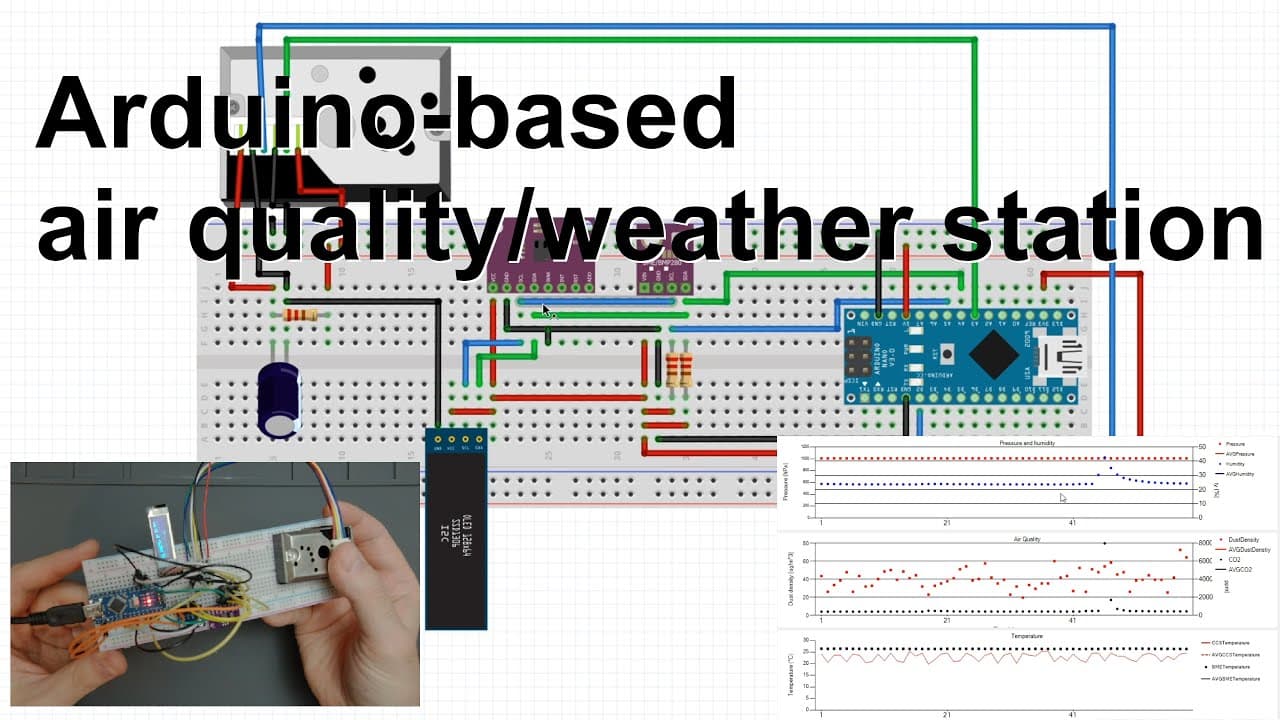
To build an Arduino-based air quality monitor, use an Arduino Nano, a BME280 sensor for temperature and humidity, a CCS811 sensor for CO2 detection, and a dust sensor. Ensure proper I2C connections for multiple sensors, and note that airflow is vital for accurate measurements. The OLED display provides real-time data visualization, making it effective for monitoring air quality.
Transcript
welcome everyone in this video i'm going to talk about my extended air quality station or air quality slash weather station so i put everything together on this breadboard but later on i will show you another drawing of the circuit so you can see how the connections are made up so now let's talk about the parts which are in this system so first of ... Read More
Key Insights
- 👱 Building an air quality and weather station can be achieved using common electronic components, primarily the Arduino Nano and various sensors.
- 🇦🇪 The BME280 sensor is a multifunctional device that simplifies temperature, humidity, and pressure measurements into one unit, enhancing usability.
- 🫢 Sensor placement is crucial; designers should ensure airflow to obtain accurate and reliable readings from dust and gas sensors.
- 💨 I2C communication is an efficient way to connect multiple sensors, reducing wiring complexity and facilitating future expansions.
- 📚 Proper coding techniques and libraries, such as the ASCII-based library for OLED displays, optimize memory usage in microcontroller projects.
- 🦻 Visual representation of data can aid in understanding air quality trends over time, making it easier to analyze environmental changes.
- ⌛ Observing real-time data fluctuations, like CO2 levels changing due to breathing, illustrates the system's responsiveness and practical applications in monitoring.
Install to Summarize YouTube Videos and Get Transcripts
Explore YouTube Video Summarizer or Get YouTube Transcript Extractor
Questions & Answers
Q: What are the main components needed for the air quality station?
The primary components include the Arduino Nano for processing, a 128x32 OLED display for visual output, the BME280 sensor for measuring temperature, humidity, and pressure, and a CCS811 sensor for volatile organic compounds. Additionally, a dust sensor is included to monitor particulate matter in the air.
Q: How does the dust sensor work in measuring air quality?
The dust sensor operates by using an infrared LED to illuminate particles in the air. The amount of light scattered back by these particles is detected, and the output voltage corresponds to the dust concentration. Higher dust levels result in increased output voltage, which the Arduino reads and processes.
Q: Why is it important for the sensors to have airflow around them?
Proper airflow around the sensors ensures that they can accurately measure environmental conditions. If the sensors are enclosed without air circulation, the measurements could be unreliable. The presenter recommends using a small fan or relying on natural convection for optimal sensor performance.
Q: What is the significance of using I2C for sensor connections?
I2C simplifies connections by allowing multiple devices to share the same two wires for data (SDA) and clock (SCL). This reduces the complexity of wiring and enables easy scalability, as devices can be added or removed from the circuit without altering the basic setup.
Q: How is the data displayed on the OLED?
The OLED display shows formatted data in a structured manner. The first line typically presents temperature and humidity, the second displays pressure and altitude, while subsequent lines indicate CO2 levels and dust concentration. The information is refreshed periodically to provide real-time updates.
Q: What challenges might one face when assembling this station?
Common challenges include ensuring proper connections among components, troubleshooting data communication issues, and ensuring sensor calibration for accurate readings. The physical layout may also pose a challenge, as ensuring adequate airflow around sensors can be difficult in compact setups.
Q: How is data visualization handled in the software discussed?
The software allows users to visualize the captured data through graphs and charts in real-time. It aggregates different environmental metrics such as temperature, humidity, dust density, and CO2 levels, providing an interactive way to monitor air quality. Users can also see average values to identify trends.
Q: What resources are available for users to get the source code?
The presenter has made the source code for the Arduino available on Pastebin, encouraging viewers to check the description for access. This allows users to replicate the project or modify it for their specific needs.
Summary & Key Takeaways
-
The video describes the assembly of an Arduino-based air quality monitoring station, detailing essential components such as the Arduino Nano, OLED display, and various sensors including dust and gas sensors.
-
The presenter outlines the setup process, connection details using I2C communication, and highlights the importance of sensor placement for accurate measurements.
-
The software component is discussed, including code snippets for data collection and visualization, demonstrating how to use the OLED display and sending formatted data to a computer for analysis.
Read in Other Languages (beta)
Share This Summary 📚
Summarize YouTube Videos and Get Video Transcripts with 1-Click
Try YouTube Summary with ChatGPT & Claude or YouTube Transcript Generator
Explore More Summaries from Curious Scientist 📚
Summarize YouTube Videos and Get Video Transcripts with 1-Click
Try YouTube Summary with ChatGPT & Claude or YouTube Transcript Generator