How to debug LangGraph workflows
TL;DR
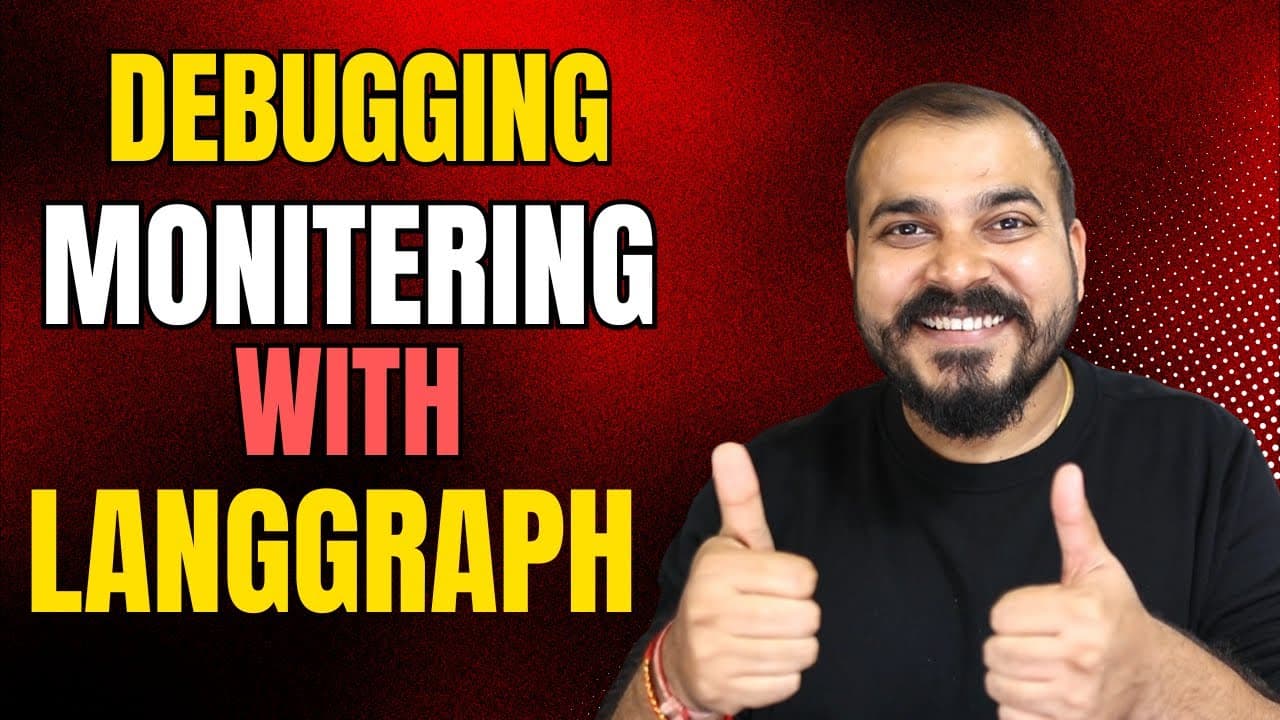
Debugging and monitoring are essential for any LangGraph app; use LangSmith and Langraph Studio to trace requests, capture inputs and outputs, and visualize graph execution. The video covers setting up API keys, dashboards, and a hands on example to track a simple graph flow.
Transcript
Hello guys. So we are going to continue the discussion with respect to our langraph crash course. Already I have said that we are going to cover this into multiple parts and specifically I had written about part one, part two and part three. In the part one uh we discussed about the entire langraph fundamentals where when we understood how to build... Read More
Key Insights
- LangSmith is a platform for building production grade LLM applications and enables tracing and monitoring.
- Langraph Studio visualizes the execution pattern of a graph, making it easier to debug flows and tool calls.
- Debugging and monitoring are highlighted as must have skills when building agentic AI applications with LangGraph.
- LangChain and LangGraph ecosystems include tooling for playgrounds, prompt management, annotations, testing, and monitoring.
- An API key is required to use LangSmith, and creating one is demonstrated in the video.
- The LangGraph cloud environment (LangChin cloud) hosts LangSmith and Langraph Studio for end to end monitoring.
- The video uses a hands on example to show how to track graph input and output and how to interpret traces.
- Dashboard customization allows filtering by date ranges and metadata to diagnose issues over time.
- More videos from this channel:
- More from this channel: Krish Naik
Install to Summarize YouTube Videos and Get Transcripts
Explore YouTube Video Summarizer or Get YouTube Transcript Extractor
Questions & Answers
Q: How to set up LangSmith API key for LangGraph debugging
Setting up the LangSmith API key is the first step to enable tracing and monitoring in LangGraph workflows. The video guides you through signing up, creating a project, and generating a key named for easy identification. This key allows you to track requests, visualize traces, and monitor the behavior of your graph across sessions.
Q: What is Langraph Studio used for in debugging
Langraph Studio is used to visualize graph execution and interact with it during debugging. It helps you see the flow of inputs and outputs, the sequence of tool calls, and how the model responses propagate through the graph. This visualization aids in quickly identifying bottlenecks or misbehaving components.
Q: Why is debugging and monitoring described as a must for LangGraph apps
Debugging and monitoring are described as must tasks because they provide visibility into how your generative AI application behaves in production. They enable you to trace inputs, model outputs, and the overall flow, which is essential for reliability, safety, and performance improvements in agentic systems.
Q: What cloud tools are mentioned for monitoring
The video mentions LangSmith and Langraph Studio as cloud based tools for monitoring and debugging. LangSmith handles tracing, metrics, and dashboards, while Langraph Studio offers a specialized IDE for agentic workflows, enabling visualization, interaction, and debugging within the LangGraph server API ecosystem.
Q: What initial steps are shown to begin debugging with LangGraph
Initial steps include creating a LangSmith API key, setting up a tracing project in Langraph cloud, and configuring your development environment to load the key. This setup enables trace collection, dashboards, and the ability to monitor the flow of a simple graph in real time.
Q: What is demonstrated with a simple state graph in the video
The video demonstrates building a simple state graph with a tool call and tracking it through LangSmith and Langraph Studio. The example illustrates how to instrument the code, load environment variables, and observe how inputs are processed and how outputs are produced within the graph.
Q: How does the video suggest diagnosing issues in a graph
To diagnose issues, the video recommends using dashboards to view traces over selected date ranges, filtering metadata, and inspecting individual requests. By analyzing the sequence of events and the associated data, you can identify where the graph deviates from expected behavior and apply fixes.
Q: What audience benefit is highlighted for resume skills
The speaker notes that mastering debug and monitoring with LangSmith and Langraph Studio is valuable for resumes and interviews. It signals practical expertise in maintaining production grade AI systems, and demonstrates the ability to monitor complex agentic workflows end to end, which is highly relevant for roles involving LLM based solutions.
Summary & Key Takeaways
-
This segment introduces debugging and monitoring for LangGraph, emphasizing that these tasks are fundamental for production grade AI apps and that LangSmith and Langraph Studio are core tools in the Lang chain ecosystem.
-
It demonstrates creating a LangSmith API key, setting up a project, and using dashboards to monitor traces and requests, illustrating how to diagnose issues in real time.
-
It concludes with a practical coding walkthrough that shows how to structure a simple state graph with tools and track its execution within Langraph Studio and LangSmith cloud integration.
Read in Other Languages (beta)
Share This Summary 📚
Summarize YouTube Videos and Get Video Transcripts with 1-Click
Try YouTube Summary with ChatGPT & Claude or YouTube Transcript Generator
Explore More Summaries from Krish Naik 📚

Summarize YouTube Videos and Get Video Transcripts with 1-Click
Try YouTube Summary with ChatGPT & Claude or YouTube Transcript Generator