How to Monitor Google Organic Search Traffic in Looker Studio
TL;DR
To monitor Google organic search traffic effectively, use Looker Studio to combine data from Google Analytics and Search Console. The provided dashboard template features key metrics like sessions, engagement rate, and click-through rate, allowing you to visualize trends and make informed decisions about your website's performance.
Transcript
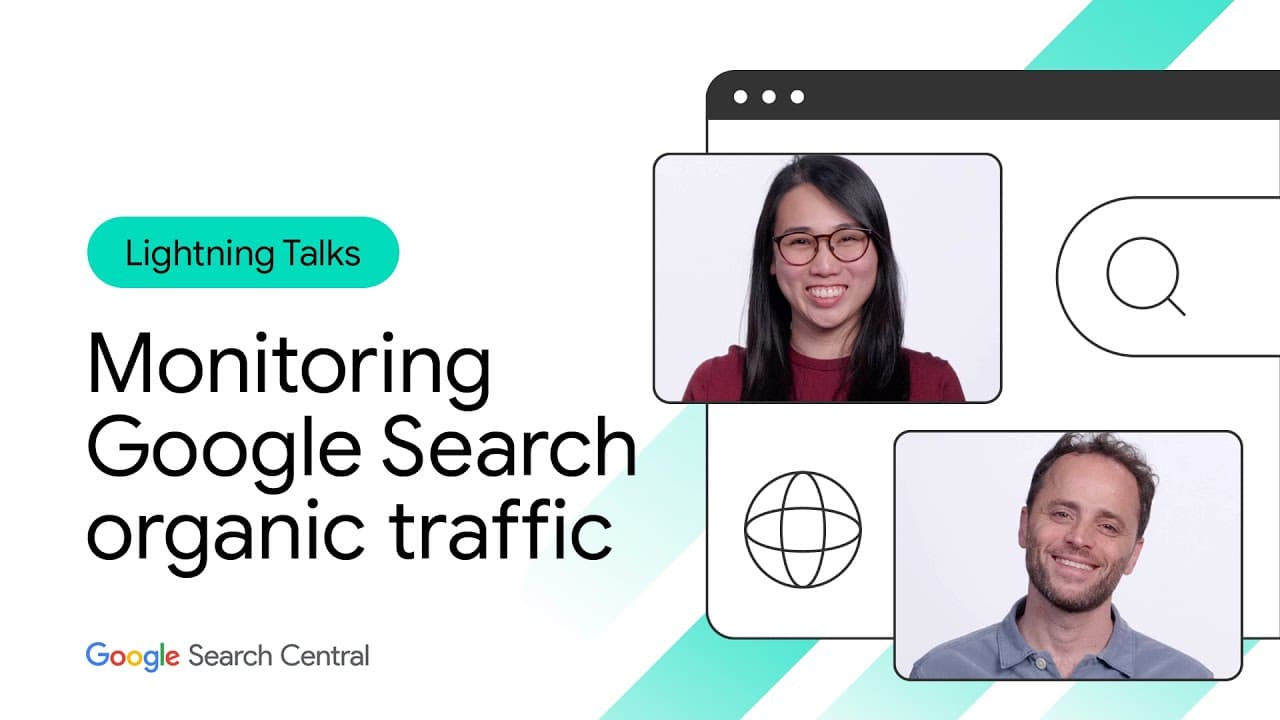
DANIEL WAISBERG: Hi. I'm Daniel Waisberg. CHERRY PROMMAWIN: Hi. I'm Cherry Prommawin. DANIEL WAISBERG: And in this video, we'll talk about-- [DRUM ROLL] CHERRY PROMMAWIN: Monitoring Google organic search traffic using Search Console, Google Analytics, and Looker Studio. And for that, we created a Looker Studio dashboard template, which you can use ... Read More
Key Insights
- Looker Studio allows users to create interactive dashboards and reports by connecting to various data sources, offering a comprehensive view of data through charts and visualizations.
- The video introduces a Looker Studio dashboard template designed to monitor Google organic search traffic using data from Search Console and Google Analytics.
- The dashboard uses distinct colors to differentiate data sources: orange for Google Analytics and blue for Search Console, aiding in easy data interpretation.
- Key metrics such as sessions, engagement rate, returning users, clicks, and click-through rate are highlighted to assess website performance effectively.
- The dashboard provides flexibility in data analysis by allowing users to select specific accounts, countries, and devices for tailored insights.
- Search Console data is crucial for understanding site indexing, crawling, and structured data, offering deeper insights beyond basic traffic metrics.
- The video emphasizes the importance of comparing trends and patterns rather than exact numbers when analyzing data from different sources.
- Additional resources and templates are provided to help users explore and optimize their search traffic analysis using Looker Studio and related tools.
Install to Summarize YouTube Videos and Get Transcripts
Explore YouTube Video Summarizer or Get YouTube Transcript Extractor
Questions & Answers
Q: What is the primary purpose of Looker Studio?
Looker Studio is designed to create, share, and collaborate on interactive dashboards and reports. It allows users to connect to various data sources, visualize data using charts and graphs, and add interactive controls for deeper data exploration. This makes it a valuable tool for monitoring and analyzing data effectively.
Q: How does the dashboard differentiate between data from Search Console and Google Analytics?
The dashboard uses color coding to differentiate between data sources: orange represents Google Analytics data, while blue indicates Search Console data. This visual distinction helps users quickly recognize and interpret data from each source, ensuring a more straightforward analysis process.
Q: What are some key metrics highlighted in the dashboard?
The dashboard highlights several key metrics, including sessions, engagement rate, returning users, clicks, and click-through rate. These metrics provide a quick assessment of website performance, allowing users to track traffic volume, user engagement, and the effectiveness of organic search efforts.
Q: How can users customize their data analysis using the dashboard?
Users can customize their data analysis by selecting specific accounts, countries, and devices through the data control feature. This flexibility allows for tailored insights, enabling users to focus on particular segments of their audience and compare data consistently across different parameters.
Q: Why is Search Console important for website analysis?
Search Console is vital for website analysis because it provides in-depth insights into site indexing, crawling, and structured data. It can confirm if Google can find and crawl a website, list indexing problems, and monitor sitemap status. Such information is crucial for optimizing site visibility and performance in search results.
Q: What should users do if they notice a significant change in traffic patterns?
If users notice a significant change in traffic patterns, they should investigate further using Search Console and Google Analytics. Analyzing specific queries, pages, and traffic acquisition reports can help identify the cause of the change. The video also provides resources for troubleshooting traffic drops.
Q: How does the video suggest users interpret differences in data from Search Console and Google Analytics?
The video suggests that users focus on comparing trends and patterns rather than exact numbers when analyzing data from Search Console and Google Analytics. Differences in data collection methods mean that numbers may not match exactly, but consistent trends should still be apparent across both platforms.
Q: What additional resources are provided for users in the video?
The video provides several resources, including links to the dashboard template, Search Console, and documentation for debugging traffic drops. It also encourages users to explore the Search Console training YouTube series for a deeper understanding of available data and recommendations for optimizing search efforts.
Summary & Key Takeaways
-
In the video, Cherry Prommawin and Daniel Waisberg discuss how to monitor Google organic search traffic using Search Console, Google Analytics, and Looker Studio. They introduce a dashboard template that allows users to visualize and analyze their own data effectively.
-
Looker Studio is highlighted as a powerful tool for creating interactive dashboards, enabling users to connect various data sources and visualize data with charts, graphs, and maps. The provided template helps track essential metrics like sessions, engagement rate, and click-through rate.
-
The video also emphasizes the importance of using Search Console for deeper insights into website indexing, crawling, and structured data. It provides additional resources for users to further explore and optimize their search traffic analysis.
Read in Other Languages (beta)
Share This Summary 📚
Summarize YouTube Videos and Get Video Transcripts with 1-Click
Try YouTube Summary with ChatGPT & Claude or YouTube Transcript Generator
Explore More Summaries from Google Search Central 📚


Summarize YouTube Videos and Get Video Transcripts with 1-Click
Try YouTube Summary with ChatGPT & Claude or YouTube Transcript Generator