How to Calculate the Correlation Coefficient step-by-step
TL;DR
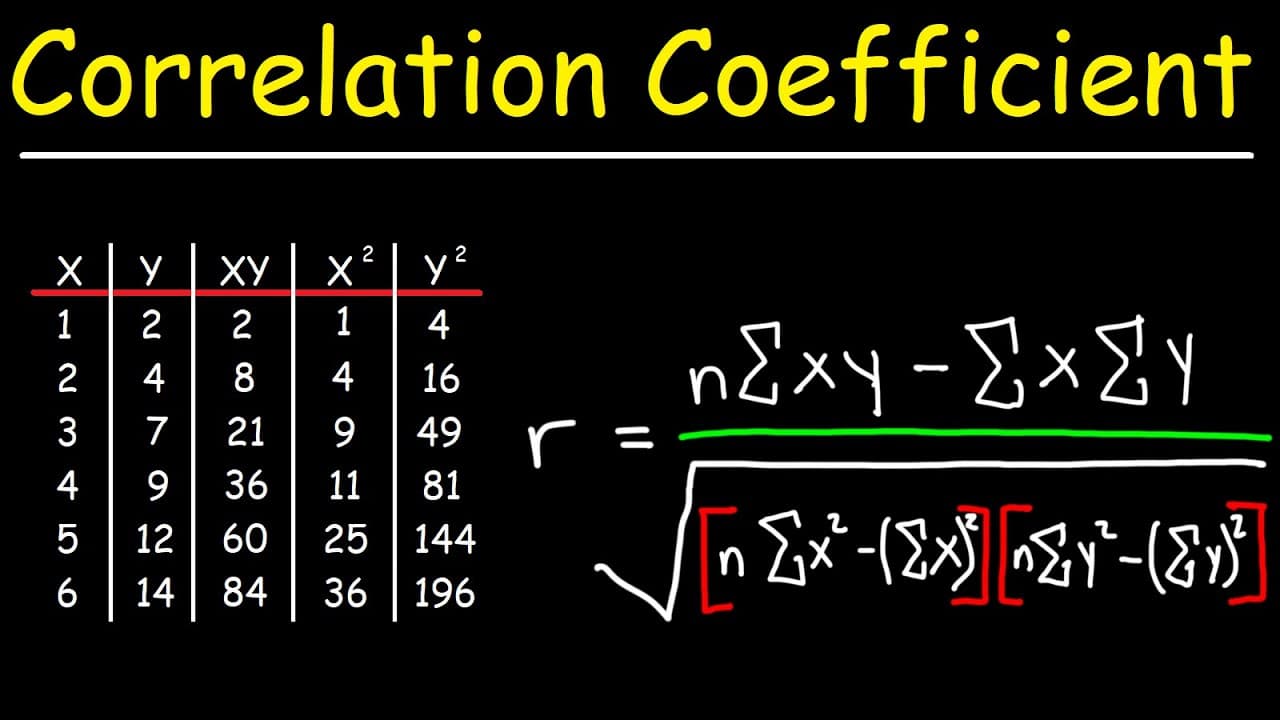
To calculate the correlation coefficient, first create a table with columns for x, y, xy, x², and y². Sum each column and substitute these totals into the formula for r, which reflects the strength and direction of the linear relationship between the two variables. Results closer to 1 or -1 indicate stronger relationships, while values near 0 suggest a weaker connection.
Transcript
in this video we're going to talk about how to calculate the correlation coefficient between two variables but before we do that let's talk about what the correlation coefficient tells us so let's say we have a straight line and we have points on the line the correlation coefficient will be positive one for this situation because all the points are... Read More
Key Insights
- 📶 The correlation coefficient measures the strength and direction of the linear relationship between two variables.
- 💯 A correlation coefficient of 1 indicates a perfect positive relationship, while -1 indicates a perfect negative relationship.
- 😚 Values closest to 1 indicate a stronger linear relationship, while values closer to 0 indicate a weaker relationship.
- 🍹 The correlation coefficient is calculated by summing the products and squares of the variables, as well as their sums.
- 🏑 The correlation coefficient can be used to analyze and predict the relationship between variables in various fields, such as finance, economics, and social sciences.
- 🎵 It is important to note that correlation does not imply causation, as two variables may be correlated without one causing the other.
- 🔨 The correlation coefficient is a valuable tool for researchers and analysts to understand the relationships between variables and make informed decisions.
Install to Summarize YouTube Videos and Get Transcripts
Explore YouTube Video Summarizer or Get YouTube Transcript Extractor
Questions & Answers
Q: How do you calculate the correlation coefficient?
Create columns for x, y, xy, x², and y², then calculate the product and squared values for every pair. Sum each column and substitute those totals, along with the number of paired values n, into the correlation coefficient formula.
Q: What does the correlation coefficient tell you?
The correlation coefficient describes the strength and direction of the linear relationship between two variables. A value close to positive or negative one indicates a strong linear relationship, while a value close to zero indicates little apparent linear correlation.
Q: What does a correlation coefficient of positive one mean?
A correlation coefficient of positive one means all the points lie on a straight line with a positive slope. As x increases, y increases, showing a direct relationship.
Q: What does a correlation coefficient of negative one mean?
A correlation coefficient of negative one means the points lie on a straight line that slopes downward. As x increases, y decreases, showing an inverse relationship.
Q: How should a correlation coefficient such as 0.8 be interpreted?
A value such as 0.8 represents a positive linear relationship because it lies between zero and one. In the example discussion, points close to an increasing line might produce 0.8, while more scattered points might produce a lower value such as 0.7 or 0.6.
Q: What table is needed to calculate the correlation coefficient?
The table contains five columns: x, y, xy, x², and y². The xy column multiplies each paired x and y value, while the final two columns square the individual values.
Q: What values are used in the worked correlation coefficient example?
The x values are 1, 2, 3, 4, 5, and 6, while the y values are 2, 4, 7, 9, 12, and 14. Because each column contains six values, n equals 6.
Q: What column totals are calculated in the example?
The example calculates Σx = 21, Σy = 48, Σxy = 211, Σx² = 91, and Σy² = 490. These totals are then substituted into the formula for r.
Summary & Key Takeaways
-
The correlation coefficient measures the degree of linear relationship between two variables.
-
A positive correlation coefficient indicates a direct relationship between the variables, while a negative coefficient indicates an inverse relationship.
-
The correlation coefficient ranges from -1 to 1, with values closer to 1 or -1 indicating a stronger linear relationship.
Read in Other Languages (beta)
Share This Summary 📚
Summarize YouTube Videos and Get Video Transcripts with 1-Click
Try YouTube Summary with ChatGPT & Claude or YouTube Transcript Generator
Explore More Summaries from The Organic Chemistry Tutor 📚



Summarize YouTube Videos and Get Video Transcripts with 1-Click
Try YouTube Summary with ChatGPT & Claude or YouTube Transcript Generator