How Do Standard Scores Make Tests Comparable?
TL;DR
Standard scores convert raw assessment results into interpretable scales with fixed means and standard deviations, allowing scores to be interpreted through the normal distribution and compared across different instruments. Z scores, T scores, deviation IQs, stanines, Sten scores, normal curve equivalents, and CEEB scores use distinct scales, while percentile rank is an ordinal measure rather than a standard score.
Transcript
hello this is dr. Grande well to my video on standard scores and counseling assessment so let's get started by answering the question what is a standard score well it's a score that has been converted to an interpretable scale from its raw value so when we assess client using an instrument we get a raw score all right so for example... Read More
Key Insights
- A standard score is a raw assessment score converted into an interpretable scale with a predetermined mean and standard deviation. This conversion gives meaning to results that would otherwise reveal little about a client’s standing or performance.
- The normal distribution is useful for interpreting standard scores. A T score of 60 is one standard deviation above the mean and is equal to or greater than 84 percent of the scores produced by that instrument.
- Standard scores make different assessments comparable by expressing their results on shared scales. For example, results from an anxiety inventory and a depression inventory can be compared after both raw scores have been converted into the same type of standard score.
- A Z score has a mean of 0 and a standard deviation of 1. It is calculated by subtracting the sample mean from the observed score and dividing the result by the standard deviation.
- A T score has a mean of 50 and a standard deviation of 10. It can be calculated from a Z score by multiplying the Z score by 10 and adding 50, so a Z score of negative 2 becomes a T score of 30.
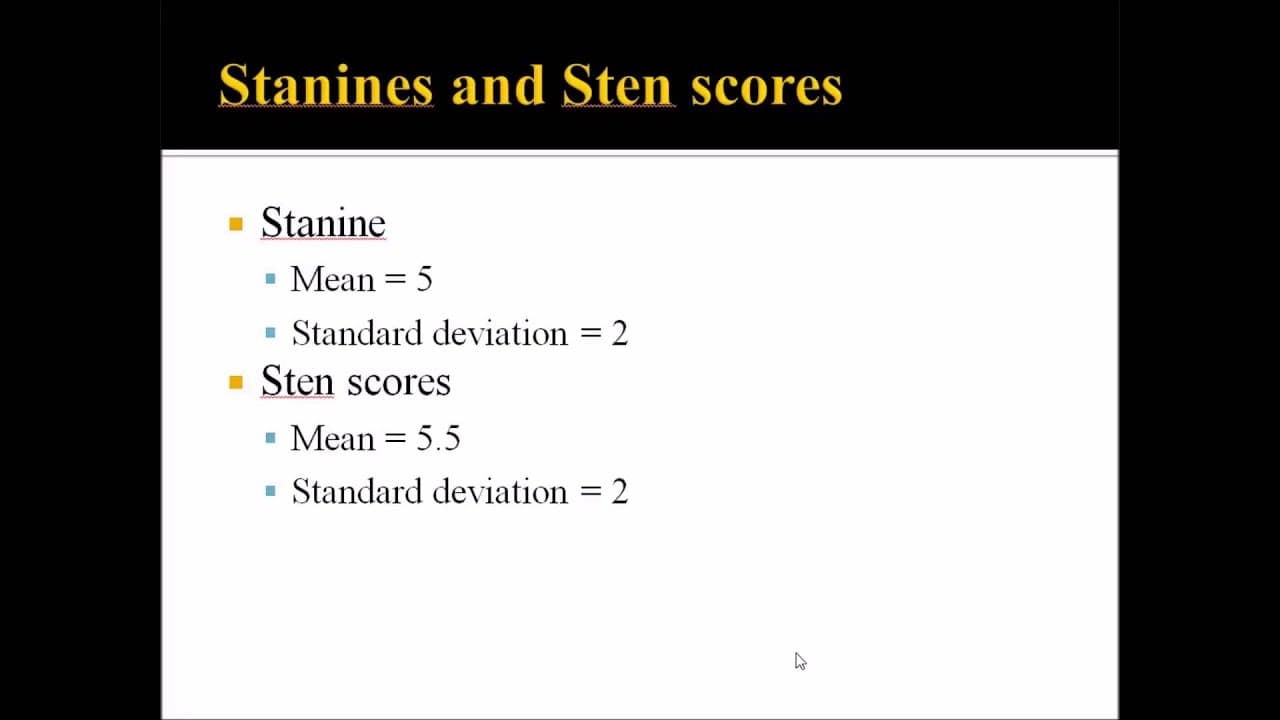
- Stanine and Sten scores use limited ranges that reduce reporting detail. Stanines range from 1 to 9 with a mean of 5, while Sten scores range from 1 to 10 with a mean of 5.5 and a standard deviation of 2.
- Deviation IQ scores commonly have a mean of 100 and a standard deviation of 15. They are widely used in intelligence testing, although some deviation IQ systems use a different standard deviation, making the particular scale important when interpreting results.
- Percentile rank is an ordinal measure rather than a standard score. The difference between the 52nd and 55th percentiles is not equivalent to the difference between the 70th and 73rd percentiles, so percentile ranks cannot appropriately be summed or averaged.
Install to Summarize YouTube Videos and Get Transcripts
Explore YouTube Video Summarizer or Get YouTube Transcript Extractor
Questions & Answers
Q: What is a standard score in counseling assessment?
A standard score is a raw assessment result converted into an interpretable scale with a fixed mean and standard deviation. A raw score, such as endorsing 33 of 50 responses, does not provide much meaning by itself. Conversion allows the score to be interpreted through the normal distribution and compared with results from other assessments using the same standard-score system.
Q: Why are standard scores useful for comparing assessments?
Standard scores allow assessments with different raw-scoring systems to be placed on a common interpretive scale. An anxiety inventory and a depression inventory may calculate raw results differently, but converting both results to the same standard-score type makes comparison possible. Their fixed means and standard deviations also clarify where each result lies within the relevant score distribution.
Q: How is a Z score calculated from an observed score?
A Z score is calculated by subtracting the sample mean from the observed score and dividing that difference by the standard deviation. For an IQ score of 130, the calculation uses a mean of 100 and a standard deviation of 15. Subtracting 100 from 130 gives 30, and dividing 30 by 15 produces a Z score of 2.
Q: How do you convert a Z score into a T score?
A T score is calculated by multiplying the Z score by 10 and then adding 50. This conversion reflects the T-score scale, which has a mean of 50 and a standard deviation of 10. For example, multiplying a Z score of negative 2 by 10 gives negative 20, and adding 50 produces a T score of 30.
Q: What are stanine and Sten scores used for?
Stanine and Sten scores are standard-score systems that compress assessment performance into a limited number of units. A stanine ranges from 1 to 9 and has a mean of 5. A Sten score ranges from 1 to 10, has a mean of 5.5, and has a standard deviation of 2. Their limited ranges provide less performance detail, while stanines are widely used in educational settings.
Q: What are the main scales used for deviation IQ and NCE scores?
Deviation IQ scores are widely used in intelligence testing and commonly have a mean of 100 and a standard deviation of 15, as used by the Wechsler scales. Other deviation IQ systems can use different standard deviations. The normal curve equivalent, or NCE, has a mean of 50 and a standard deviation of 21.06 and is popular in educational assessment.
Q: What is the CEEB standard-score scale?
CEEB scores were originally developed by the College Entrance Examination Board, which is now called the Educational Testing Service. Assessments such as the SAT and GRE use this standard-score system. The CEEB scale ranges from 200 to 800, has a mean of 500, and has a standard deviation of 100.
Q: Why is percentile rank not considered a standard score?
Percentile rank indicates that a test score is equal to or greater than a specified percentage of scores in its frequency distribution. It is not a standard score because its units are not equal intervals. The change from the 52nd to 55th percentile is not equivalent to the change from the 70th to 73rd percentile. Percentile rank is therefore ordinal, and its values cannot appropriately be summed or averaged.
Summary & Key Takeaways
-
A raw score, such as the number of endorsed assessment responses, has little meaning by itself. Converting it to a standard score places it on an interpretable scale with a fixed mean and standard deviation. This allows counselors to locate the result within a normal distribution and understand its relative position.
-
Several standard-score systems serve different assessment contexts. Z scores use a mean of 0 and standard deviation of 1, while T scores use 50 and 10. Deviation IQs commonly use 100 and 15. Stanines, Sten scores, normal curve equivalents, and CEEB scores provide additional reporting scales.
-
Percentile rank indicates the percentage of observed scores that a test score equals or exceeds, but it is not a standard score. Its units are unequal because it follows the curved frequency distribution. Percentile ranks therefore represent an ordinal measurement level, so calculating their sums or averages is not appropriate.
Read in Other Languages (beta)
Share This Summary 📚
Summarize YouTube Videos and Get Video Transcripts with 1-Click
Try YouTube Summary with ChatGPT & Claude or YouTube Transcript Generator
Explore More Summaries from Dr. Todd Grande 📚





Summarize YouTube Videos and Get Video Transcripts with 1-Click
Try YouTube Summary with ChatGPT & Claude or YouTube Transcript Generator