What Is a Break of Structure in Day Trading?
TL;DR
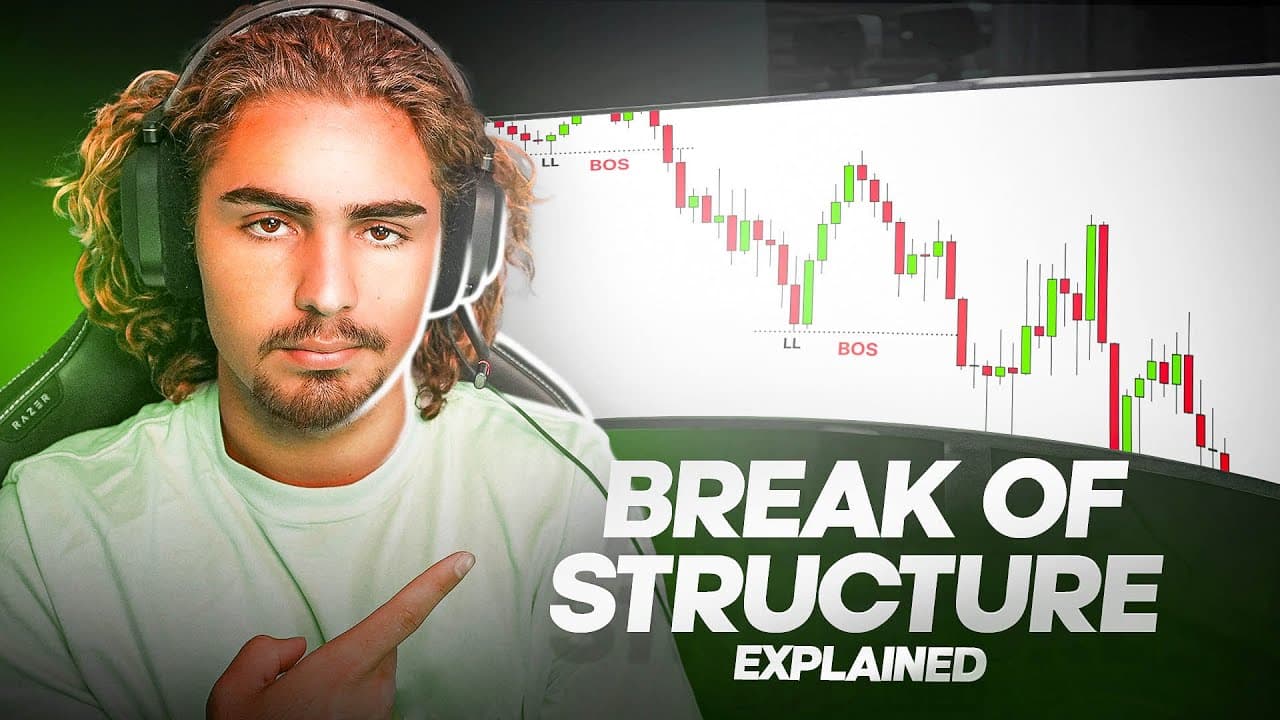
A break of structure happens when price closes a full candle beyond the most recent swing point: below the most recent low in an uptrend, or above the most recent high in a downtrend. A wick through the level does not count, only a candle closure. It signals a trend shift and can indicate orders being filled, but it means nothing without context.
Transcript
what is good jitl lets welcome to my new and improved break of structure video as you guys know I would never take a trade without seeing a break of structure on any of my execution time frames and for those of you guys who don't know me my name is tjr I've made over seven figures in profit day trading just at the right age of 22 years old and toda... Read More
Key Insights
- Break of structure identifies a trend shift in current market structure and can indicate orders being filled. It is the one confluence TJR says he would never take a trade without seeing on any of his execution time frames.
- The market moves in exactly three ways: an uptrend made of higher highs and higher lows, a downtrend made of lower lows and lower highs, and consolidation where price moves sideways with no actual trend.
- A break of structure in an uptrend occurs when the most recent low gets closed below. Because an uptrend is defined by higher highs and higher lows, closing under that low breaks the very definition of the current structure.
- A break of structure in a downtrend occurs when price closes above a prior high. That higher high eventually turns into a higher low, and the sequence flips the structure from lower highs and lower lows into an uptrend.
- A candle closure is required, not a wick. Price poking through a swing level with a wick and closing back inside does not qualify as a break of structure on any time frame.
- A high is a two-candlestick pattern: a move up followed by a move down. Traders waiting for an upside break of structure monitor those highs, and traders waiting for a downside break monitor the lows.
- Consolidation produces many breaks of structure inside the range, which is what makes it difficult. The usable signal there is a breakout of the range highs or lows rather than a break of structure within it.
- Confluences mean nothing without context. TJR points to a real downside break of structure where price immediately ripped back up, and says taking it at 12 p.m. on a Friday near market close would have been an idiot's trade.
Install to Summarize YouTube Videos and Get Transcripts
Explore YouTube Video Summarizer or Get YouTube Transcript Extractor
Questions & Answers
Q: What is a break of structure in trading?
A break of structure identifies a trend shift in current market structure, and it can also indicate orders being filled. In practical terms, it is the moment price violates the pattern that defined the existing trend. In an uptrend built on higher highs and higher lows, structure breaks when the most recent low gets closed below. In a downtrend built on lower lows and lower highs, structure breaks when a prior high gets closed above. TJR describes it as the single confluence he would never take a trade without seeing on any of his execution time frames.
Q: How do you identify a break of structure in an uptrend?
In an uptrend, you monitor the lows. An uptrend consists of higher highs and higher lows, so the structure is broken the moment the most recent low gets closed underneath. TJR keeps it deliberately basic: there are no calculations or approximations involved, just watching for a candle to fully close below that swing low on your chosen time frame. Once that happens, price typically begins printing a lower low and then a lower high, which confirms the reversal of the prior uptrend structure.
Q: Why does a candle closure matter instead of a wick?
TJR states that a break of structure requires a candle closure, not a wick. Price can trade through a swing high or swing low intrabar and then pull back inside the range before the candle finishes, which leaves the original structure intact. Only when the candle fully closes beyond the level do you treat the structure as broken. He specifically calls out that a lot of people struggle with this distinction, and he devotes part of the video to showing examples of what is not a break of structure precisely because wicks fool traders.
Q: What is a break of structure in a downtrend?
A downtrend consists of lower highs and lower lows, so structure breaks to the upside when price closes above a high. The logic is in the name: the current structure is a repeating sequence of lower high, lower low, and once a higher high prints, that sequence no longer holds. That higher high will eventually be followed by a higher low, and from there the market has flipped into an uptrend with higher highs and higher lows.
Q: How does break of structure work in consolidation?
Consolidation is price moving sideways with no actual trend, and TJR notes this is the frustrating case because there will be lots of breaks of structure all within the range. Since there is no trend to break, the more useful signal is a breakout of the range itself. If you see a candle closure above the range highs and price starts forming an uptrend, that breaks out of the consolidation structure. The same applies to the downside when price closes below the range lows and begins a downtrend.
Q: What counts as a high or low when marking structure?
TJR defines a high as a two-candlestick pattern: a move up followed by a move down. On his chart colors, that means a blue candlestick followed by a black candlestick. When you are waiting for an upside break of structure, you monitor those highs and wait for a full closure above one. When you are waiting for a downside break, you monitor the lows in the same way. In his chart example he notes that the breaking candle closed above all three prior candles, making it a clear break.
Q: Should you buy immediately when price breaks structure?
No. TJR is explicit that it is not as simple as seeing price break structure and pressing buy or sell. He shows a real example where price broke structure to the downside by closing under the most recent low, and then price ripped straight back up. He adds that anyone taking that trade would have been an idiot because it happened at 12 p.m. on a Friday with the market about to close. Confluences essentially mean nothing without context, and only when combined with a full strategy do they produce good trades.
Q: How does break of structure fit with other trading confluences?
Break of structure is taught as one confluence among several. TJR mentions he has just remade a liquidity video, is making this break of structure video, and plans a new fair value gap video next. He says that in roughly the next month he will release a video combining all of these confluences to show how to actually execute a trade. This video is scoped only to teaching the break of structure concept itself, not a complete entry system.
Q: Who is TJR and what is his trading background?
TJR introduces himself as a day trader who has made over seven figures in profit day trading at 22 years old. He frames this video as the new and improved version of his break of structure content, and says it is the kind of video that would have helped him a lot as an unprofitable trader when he was learning. His stated teaching style is deliberately basic and fundamental so that anybody can understand it, avoiding complex calculations and approximations.
Summary & Key Takeaways
-
Break of structure identifies a trend shift in current market structure and can also indicate orders being filled. TJR, who says he made over seven figures day trading by age 22, teaches it as the confluence he will never trade without seeing on his execution time frames, using line drawings before moving to candlesticks.
-
The three market states are uptrend (higher highs, higher lows), downtrend (lower lows, lower highs), and consolidation (sideways). In an uptrend, structure breaks when the most recent low is closed below. In a downtrend, structure breaks when a high is closed above. The name is the definition: the current structure gets broken.
-
On the charts, a 5-minute downtrend flips when a candle fully closes above the prior high, after which price prints higher highs and higher lows repeatedly. The reverse case shows a candle closing under the most recent low, turning an uptrend into lower lows and lower highs.
-
Closure matters, not wicks. TJR stresses that price must fully close beyond the level, and promises a follow-up video combining break of structure with liquidity and fair value gaps to show full trade execution rather than blind entries on a single signal.
Read in Other Languages (beta)
Share This Summary 📚
Summarize YouTube Videos and Get Video Transcripts with 1-Click
Try YouTube Summary with ChatGPT & Claude or YouTube Transcript Generator
Explore More Summaries from TJR 📚






Summarize YouTube Videos and Get Video Transcripts with 1-Click
Try YouTube Summary with ChatGPT & Claude or YouTube Transcript Generator