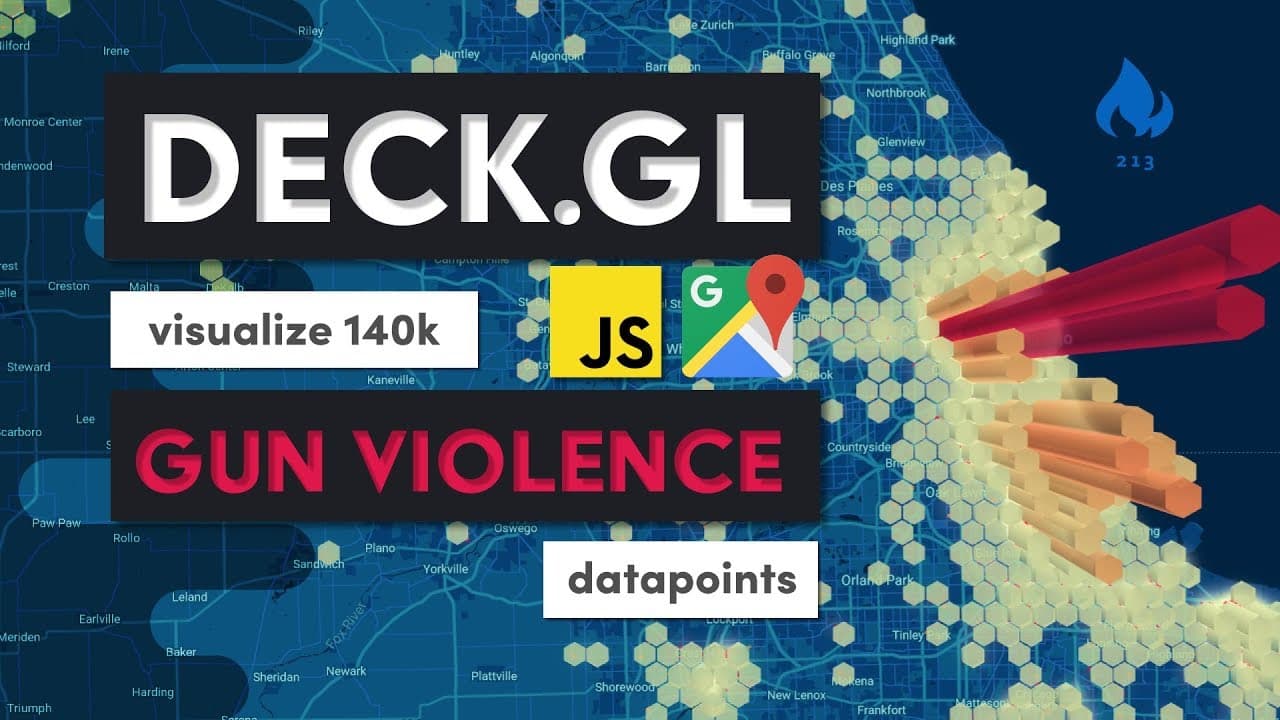
Visualize 140k Gun Violence Incidents with Deck.gl & Google Maps
TL;DR
- Utilize Deck GL to visualize gun violence data efficiently on Google Maps with various interactive visualization techniques.
Transcript
today will take over 140,000 data points of people being killed or injured by guns and visualize them with deck GL and Google Maps we can go from a heat map of the entire country down to the actual street view of a neighborhood where the [ __ ] went down we'll start by adding a scatter plot layer for every single point in the data set then we'll ad... Read More
Key Insights
- 🌥️ Deck GL enables efficient visualization of large datasets by offloading computations to the GPU using WebGL.
- 😐 Data for gun violence visualization comes from the Gun Violence Archive, covering incidents from 2013 to 2018 to provide a neutral visual representation.
- 🥵 Scatter plot layers, tooltips, heat maps, and hexagons are utilized in Deck GL for interactive and detailed visualization of gun violence data.
- 🏋️ Visualization accuracy and flexibility can be enhanced by customizing colors, weights, pixel radius, and elevation weights for different visualization layers.
- 😒 Dec GL uses a reactive programming paradigm, making it simple to use for most front-end developers with minimal setup requirements.
- 🤩 Google Maps API key, a good dataset, and basic JavaScript skills are essential to get started with Deck GL for data visualization.
- 💁 Data for visualization can be easily converted from CSV format to JSON format using tools like convert-csv-to-json for seamless usage in Deck GL.
Install to Summarize YouTube Videos and Get Transcripts
Explore YouTube Video Summarizer or Get YouTube Transcript Extractor
Questions & Answers
Q: What is Deck GL and how does it help visualize data?
Deck GL is a library created by Uber to efficiently visualize large datasets by offloading computations to the GPU using WebGL. It provides interactive 3D visuals on top of Google Maps, making data visualization seamless and engaging.
Q: Where does the data for gun violence visualization come from?
The data used for gun violence visualization comes from the Gun Violence Archive, covering incidents from 2013 to 2018. The visual aims to remain neutral, allowing users to filter data by different categories like defensive use or suicide for a comprehensive view.
Q: How does one get started with Deck GL for data visualization?
To start visualizing data with Deck GL, one needs a Google Maps API key, a good dataset, and a few lines of JavaScript code. The library follows a reactive programming paradigm, making it familiar for front-end developers to use efficiently.
Q: What visualization techniques can be used with Deck GL for gun violence data?
Deck GL offers scatter plot layers, tooltips for interactive information display, heat maps for clustering points, and hexagons for 3D visualization. These techniques help represent violence incidents on Google Maps effectively.
Summary & Key Takeaways
-
Visualize gun violence data efficiently on Google Maps with Deck GL.
-
Use scatter plot layers, tooltips, and heat maps to represent violence incidents.
-
Explore clustering points into hexagons for 3D visualization of violence levels in neighborhoods.
Read in Other Languages (beta)
Share This Summary 📚
Summarize YouTube Videos and Get Video Transcripts with 1-Click
Try YouTube Summary with ChatGPT & Claude or YouTube Transcript Generator
Explore More Summaries from Fireship 📚


Summarize YouTube Videos and Get Video Transcripts with 1-Click
Try YouTube Summary with ChatGPT & Claude or YouTube Transcript Generator