Why Can Low Volatility Signal a Market Pullback?
TL;DR
Extremely low volatility can precede a volatility spike, so the presenter favors a limited-risk VIX call spread while remaining heavily invested in stocks. Markets are near record highs, valuations are elevated, and August through October have recently produced corrections, but an expected Fed cut near an all-time high could still support positive returns if it is not driven by economic necessity.
Transcript
Get this. Stocks are at an all-time high. Gold is at an all-time high. Bitcoin all-time high. Home prices all-time high. And yet, the Fed is now expected to cut. It's basically a certainty at this point that the Fed cuts rates. So, what happens when the Fed cuts when the markets are near all-time highs? Well, the Fed is on break for August. We know... Read More
Key Insights
- Extremely low volatility is presented as a warning signal because the VIX-to-VIX-3M ratio previously reached similar lows before volatility spikes in December, February, March, and April. The presenter therefore considers a VIX hedge appropriate even while markets remain near record highs.
- A Fed rate cut near an all-time high is described as potentially bullish when the market is within 2% of its peak. The cited historical study showed that the following year was green every time, although the presenter distinguishes precautionary cuts from cuts made during economic distress.
- Rate cuts made from necessity are associated in the transcript with recessions, including cuts in 2000, 2007, and 2020. The presenter contrasts those episodes with cuts during the 1990s that were characterized as less reactive and not necessarily triggered by a crisis.
- August through October are characterized as difficult months for stocks, with recent examples including a 10% correction beginning last August, a correction from August through October in 2023, and additional declines beginning around September 1 in both 2020 and 2021.
- The S&P 500 price-to-sales valuation is described as higher than it was during the dot-com boom. Strong earnings provide some justification for elevated prices, but the presenter warns that excessive valuations eventually may need to return toward more realistic levels.
- Shorting the market outright is rejected until technical structure breaks. The presenter closed a losing QQQ debit spread after prices moved back above the all-time high, remained heavily invested, and retained only the VIX hedge to limit drag against a portfolio at a new high.
- A VIX 20/25 debit call spread is presented as a lower-cost hedge than holding leveraged volatility exchange-traded products. The September 17 spread cost $88 and had a stated maximum value of $500, producing a maximum net profit of $412 per contract.
- Berkshire Hathaway's three-month underperformance is presented as a possible valuation warning because Buffett avoids investing when he sees little value. The transcript argues that inflated markets can temporarily outperform Berkshire before declining, even though Buffett is described as evaluating value rather than deliberately timing market crashes.
Install to Summarize YouTube Videos and Get Transcripts
Explore YouTube Video Summarizer or Get YouTube Transcript Extractor
Questions & Answers
Q: Why can extremely low volatility signal a market pullback?
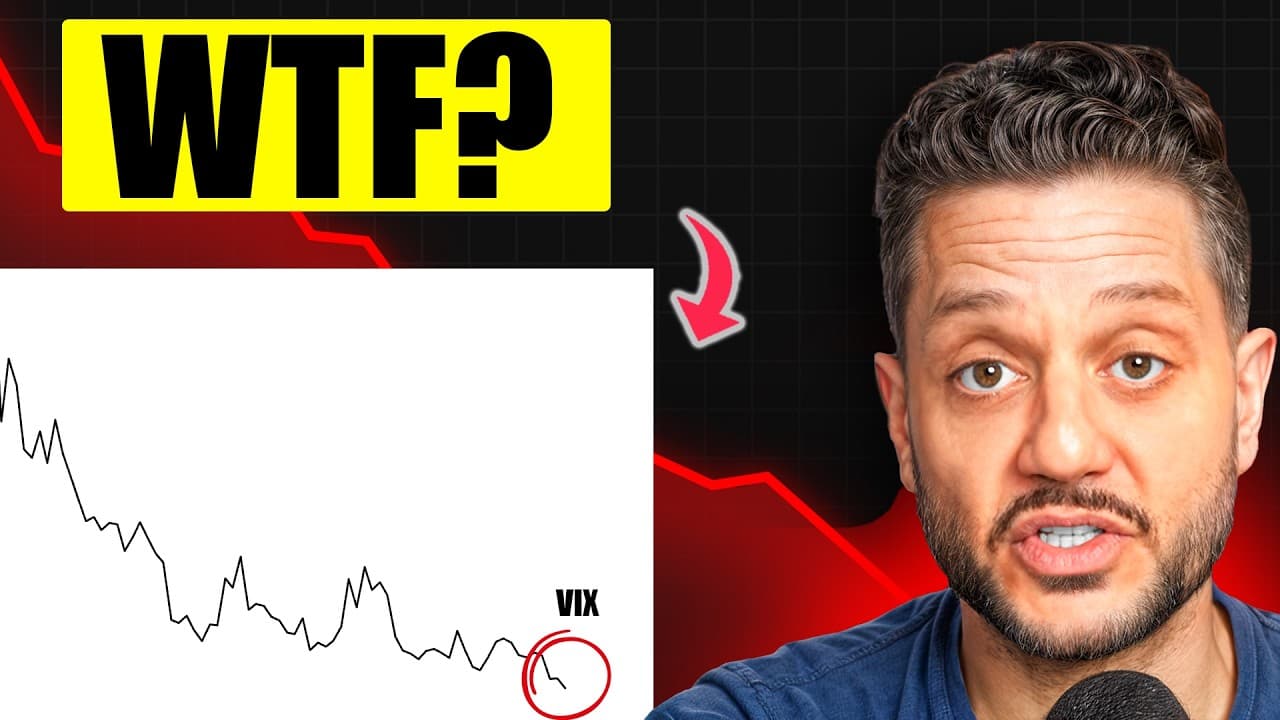
Extremely low volatility can signal complacency because the current VIX may be unusually cheap relative to expected volatility three months later. The presenter notes that the VIX-to-VIX-3M ratio reached comparable lows before volatility spikes in December, February, March, and April. With the VIX at 14.49 and its lowest close of 2025, he views a sudden volatility increase as plausible, though not guaranteed.
Q: How does the VIX-to-VIX-3M ratio work?
The VIX-to-VIX-3M ratio divides the current VIX by the level of volatility expected in three months. A particularly low ratio means current volatility is subdued compared with future expectations. According to the examples presented, similar readings preceded major VIX increases, including a December move toward 30 and additional spikes in February, March, and April, making the ratio useful as a warning indicator.
Q: How can investors hedge against a VIX spike?
The featured hedge is a VIX debit call spread that buys the 20 call and sells the 25 call with a September 17 expiration. The presenter states that the position costs $88 and can reach a maximum value of $500, leaving a maximum net profit of $412 per contract. This structure limits the initial cost while providing exposure to a rise in volatility.
Q: Why avoid leveraged volatility ETFs as long-term hedges?
Leveraged volatility products are described as poor positions to hold without a defined time frame because they continually decay by their nature. The presenter prefers a cheap VIX call spread, whose cost and maximum outcome are defined in advance. In the example, the trader risks the $88 debit for potential exposure between VIX strike prices of 20 and 25 through September 17.
Q: What happens when the Fed cuts rates near an all-time high?
The historical evidence cited in the transcript suggests that when the Fed cuts while the market is within 2% of an all-time high, the next year has always been positive in the referenced sample. The presenter cautions that the reason for the cut matters. A preventive cut near strong markets may be supportive, while a cut forced by severe economic weakness has historically accompanied recessions.
Q: Why do weak employment revisions matter for Fed policy?
Weak revisions can suggest that economic conditions were worse than initially reported, increasing pressure on the Fed to cut from necessity. The transcript says May job growth was revised from an initially discussed 144,000 to 19,000, while another reported figure was revised from 147,000 to 14,000. The presenter treats these revisions as evidence that an expected cut may reflect labor-market weakness rather than routine policy adjustment.
Q: Why is the presenter cautious during August and September?
August and September are described as choppy and sometimes among the market's worst months. The presenter cites a 10% correction beginning last August, a decline starting August 1 in 2023 and lasting until October, a further 20% fall after August 16 in 2022, and corrections beginning around September 1 in both 2020 and 2021. These examples support hedging, not assuming another decline is certain.
Q: What does Berkshire Hathaway underperformance suggest about valuations?
Berkshire Hathaway's disappointing three-month return relative to the S&P 500 is presented as a possible sign that attractive investments are scarce. Buffett is described as avoiding purchases when he sees little value rather than intentionally timing the market. During an inflated advance, that restraint can cause Berkshire to lag temporarily, and the transcript says similar periods have preceded some severe market declines.
Summary & Key Takeaways
-
Stocks, gold, Bitcoin, and home prices were described as being near all-time highs while a September 17 Fed rate cut was viewed as highly likely. The presenter argues that a cut made near market highs could be constructive, although weak revised employment figures raise concern that the Fed might be responding to economic necessity.
-
The VIX closed at its lowest level of 2025, while the VIX-to-VIX-3M ratio reached a level that previously preceded volatility spikes. Rather than shorting stocks before market structure breaks, the presenter remains heavily invested and uses a VIX hedge to seek protection without creating excessive portfolio drag through multiple simultaneous hedges.
-
Seasonal history, record price-to-sales valuation, Berkshire Hathaway's relative underperformance, and Buffett's reluctance to buy are presented as warning signs. The featured hedge is a September 17 VIX 20/25 debit call spread costing $88, with a stated maximum net profit of $412 per contract if the spread reaches its full value.
Read in Other Languages (beta)
Share This Summary 📚
Summarize YouTube Videos and Get Video Transcripts with 1-Click
Try YouTube Summary with ChatGPT & Claude or YouTube Transcript Generator
Explore More Summaries from The Traveling Trader 📚





![How I Beat the Mental Game of Trading [After 5 Years of Failure] thumbnail](/_next/image?url=https%3A%2F%2Fi.ytimg.com%2Fvi%2F4gaaGDldQwY%2Fhqdefault.jpg&w=750&q=75)
Summarize YouTube Videos and Get Video Transcripts with 1-Click
Try YouTube Summary with ChatGPT & Claude or YouTube Transcript Generator