How Could Gold Reach Several Thousand Dollars?
TL;DR
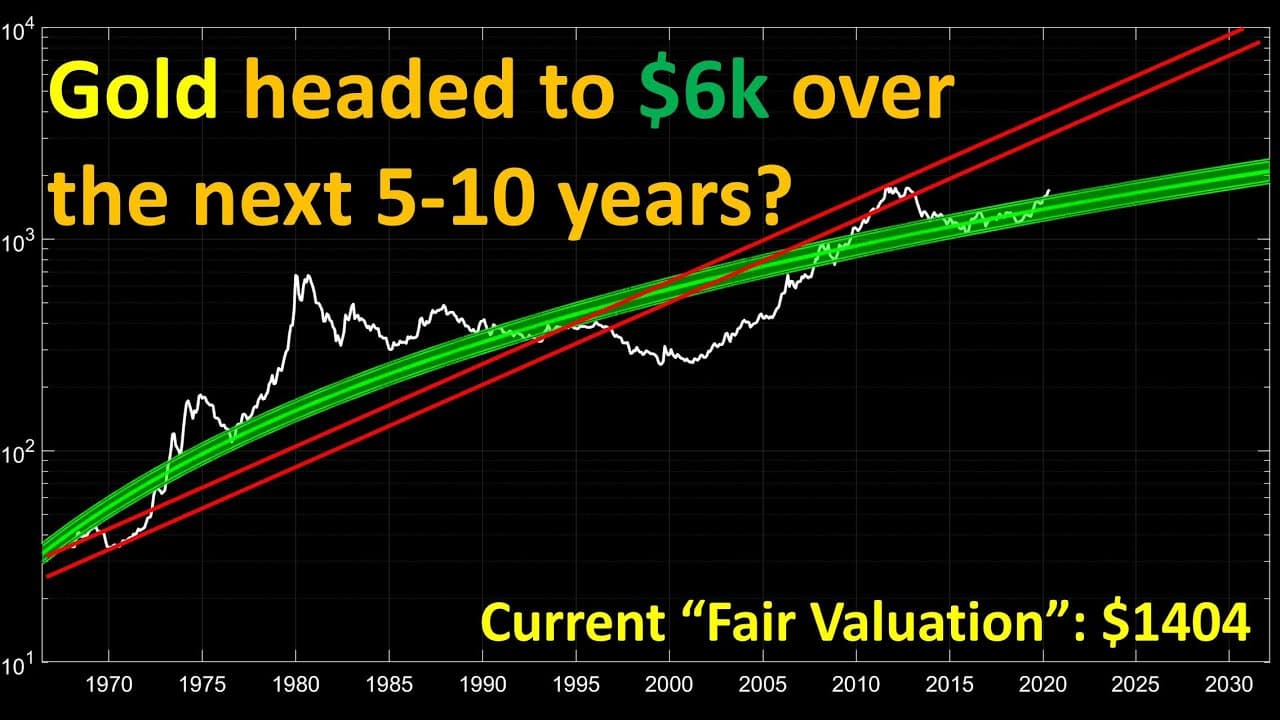
Gold could reach several thousand dollars if its price continues rising toward the upper logarithmic regression trend described in the analysis. The projection is a bullish scenario, not a certainty, because market maturation, greater efficiency, lower macro volatility, and the future rate of price appreciation could produce a slower advance than the previous major cycle.
Transcript
hey everyone and thanks for jumping back into the precious metal verse today we're gonna be talking about gold we're gonna be doing an update to the last video we did on that regression line for gold so if you're not familiar with the channel we look more into a quantitative finance approach more of a data science rather than traditional ta so if y... Read More
Key Insights
- Gold is slightly above the fair-value level estimated by the logarithmic regression model. The model fits price against time while minimizing logarithmic differences, offering a long-term quantitative perspective rather than a method for interpreting daily price movements.
- The bullish scenario is a return toward the upper red trend line drawn from earlier market turning points. Reaching that line could place gold at several thousand dollars, but the outcome depends on how quickly the price advances through the projected cycle.
- Gold has previously moved from below its regression band to above fair value, retested the band, and then entered a parabolic advance. A broadly similar structure may be developing again, although the analysis explicitly allows for the pattern to fail or change.
- Market maturation is associated with longer periods spent below or within the regression band. Greater market efficiency and reduced macro-scale volatility imply that any future parabolic rise would probably have a gentler slope than the strongest historical advance.
- The earlier major gold rally provides a comparison for the current trajectory. Applying the same proportional move and duration produces a more aggressive outcome, while adjusting for market maturation supports the more restrained possibility of gold reaching several thousand dollars.
- The current price advance has maintained a roughly similar angle to the earlier rally examined in the chart. That resemblance supports the comparison, but matching an earlier angle does not establish that the same endpoint, duration, or return will occur.
- Gold tends to perform better when the stock market is declining or making limited progress, according to the historical relationship discussed. Economic hardship and uncertainty can therefore create a setting in which gold attracts greater interest relative to traditional markets.
- Portfolio optimization can evaluate precious metals by comparing historical returns with volatility. The proposed approach would add projected returns, construct an efficient frontier, and use quadratic programming to identify an optimal portfolio containing gold, silver, and potentially other assets.
Install to Summarize YouTube Videos and Get Transcripts
Explore YouTube Video Summarizer or Get YouTube Transcript Extractor
Questions & Answers
Q: How could gold reach several thousand dollars?
Gold could reach several thousand dollars by continuing its advance toward the upper red trend line in the long-term logarithmic regression chart. The scenario assumes that gold moves above its fair-value region and develops another broad bull cycle. The analysis tempers the projection because a mature, efficient market may rise more slowly and with less macro-scale volatility than it did during the earlier major advance.
Q: What is the fair-value regression model for gold?
The fair-value model is a logarithmic regression line fitted to gold’s price over time. Its coefficients are selected to minimize the logarithmic difference between the observed price and the regression line. The model is intended to provide a macroscopic valuation framework, showing when gold trades below, near, or above its long-term trend, rather than offering detailed daily technical analysis.
Q: Why does the analysis compare the current gold cycle with an earlier rally?
The earlier rally offers a historical reference for evaluating the current move’s duration, proportional appreciation, and angle of ascent. The current trajectory appears roughly similar in slope to part of that previous advance. However, the comparison is presented as a scenario-building tool, not proof of repetition, because market efficiency, maturity, volatility, and economic circumstances can change the path of prices.
Q: What pattern around the regression band could precede a gold rally?
The pattern described begins with gold trading below the regression band, then moving above the fair-value region, returning to test the band, and finally accelerating into a parabolic phase. A similar broad structure may be visible in the more recent cycle. The analysis treats this resemblance cautiously because historical chart patterns may not recur with the same timing, steepness, or final valuation.
Q: Why might a future gold rally be less steep than a previous one?
A future rally may be less steep because the gold market appears to be maturing and becoming more efficient. The chart suggests that gold has spent increasingly long periods below or within its regression band. This development supports an expectation of reduced volatility on the macro scale, meaning that another advance above the band could unfold at a gentler angle than the earlier parabolic move.
Q: How does stock market uncertainty affect gold?
Gold tends to perform better when the stock market is falling or making little progress, according to the relationship discussed in the analysis. Economic hardship and uncertainty can increase interest in assets outside traditional equity markets. The comparison links the earlier gold advance with turmoil around the stock market and views current economic uncertainty as another environment that could support demand for gold.
Q: Is the several-thousand-dollar gold forecast guaranteed?
The forecast is not guaranteed. It is the result of extending historical regression trends, comparing the current angle of ascent with an earlier bull market, and allowing for a possible return to an upper trend line. The final price and timing would depend on the future rate of appreciation, while increasing market efficiency and lower volatility could substantially alter the projected path.
Q: How can gold and silver be included in portfolio optimization?
Gold and silver can be evaluated alongside other assets by comparing their historical returns with their volatility. Projected returns could also be added to the analysis. Those inputs can be used to build an efficient frontier, after which quadratic programming can identify a portfolio considered optimal under the chosen assumptions. The proposed framework is quantitative and can be expanded to additional precious metals or assets.
Summary & Key Takeaways
-
A logarithmic regression model places gold slightly above its estimated fair-value line. Historical price behavior suggests a possible sequence in which gold rises from below the regression band, moves above it, retests the band, and then accelerates. The analysis treats this pattern as a possible scenario rather than a reliable prediction.
-
The forecast compares the current advance with an earlier multiyear gold rally. The present move has followed a roughly similar upward angle, but the analysis does not expect an exact repetition. A more mature and efficient market could experience lower volatility and a less steep parabolic phase than it did previously.
-
Gold may perform relatively well when traditional markets face uncertainty, weakness, or limited progress. That characteristic can make precious metals useful for portfolio diversification. The proposed future research would combine gold, silver, and other assets in an optimization framework balancing historical or projected returns against volatility through an efficient frontier.
-
Key Insights input was not provided as an array in the requested schema, so the factual insights are included in the dedicated Key Insights field.
Read in Other Languages (beta)
Share This Summary 📚
Summarize YouTube Videos and Get Video Transcripts with 1-Click
Try YouTube Summary with ChatGPT & Claude or YouTube Transcript Generator
Explore More Summaries from Benjamin Cowen 📚






Summarize YouTube Videos and Get Video Transcripts with 1-Click
Try YouTube Summary with ChatGPT & Claude or YouTube Transcript Generator