Price Action Strategy: How to Trade Reversals With Momentum Loss
TL;DR
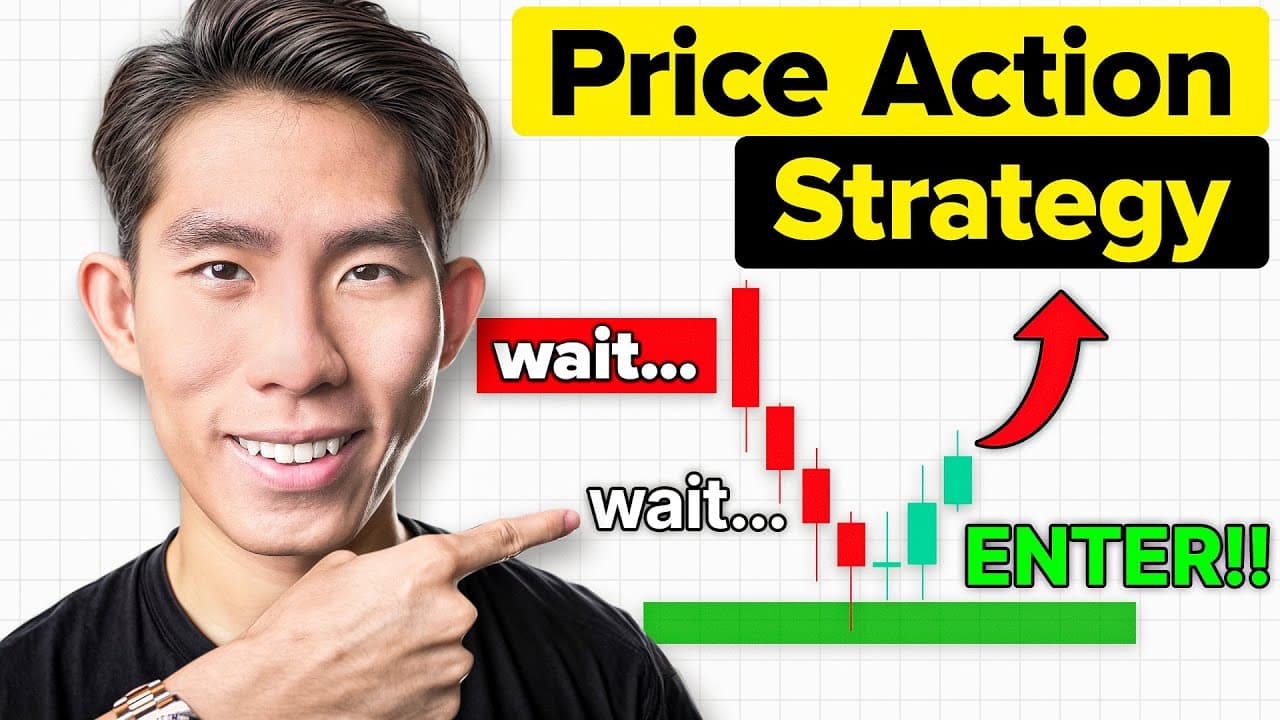
Reversals become high-probability when candlesticks shrink as price approaches a key support or resistance level, signaling momentum loss. Confirm with rejection candles like dojis or long wicks, and a color change (green at support, red at resistance). If candles stay large at the level, momentum is strong and price will likely break through, so react instead of predicting.
Transcript
so I just made about ten thousand dollars using this strategy that I'm about to show you this price action trading strategy will Makes You Filthy Rich and the best part is it is so simple once you muster it the whole gist of this strategy is based on the concept of momentum loss through Candlestick ships and sizes which is a very powerful price act... Read More
Key Insights
- Momentum loss through candlestick shifts and sizes is the core of this reversal strategy. Shrinking candles as price nears a key level show buyers or sellers are losing steam, signaling a likely reversal off that level.
- Identifying key support and resistance levels comes first. A strong support is where price hits and reverses repeatedly, and a strong resistance is where price repeatedly fails to break past and heads back down.
- High win-rate reversal setups require candles getting smaller and smaller near a key level. Big candles followed by progressively smaller ones show price is slowing and losing momentum before reversing.
- Reversal candlesticks confirm entries. A doji, a small long-wick candle rejecting support, or multiple long wick candles at a level all indicate price does not want to continue and will reverse.
- A change in candlestick color at a key level is a pro tip signal. After many green candles pushing up, a red bearish engulfing candle at resistance signals a reversal back down.
- Trades run from one key level to the next. Stop loss goes a few pips below the key support, and take profit is placed at the next key level, such as a strong resistance above.
- Big candles at a key level warn against entering. A large green candle approaching resistance shows buyers in control and price likely to burst through, trapping beginners who sell too early.
- Trading is about reacting to the market, not predicting it. Seeing a green candle at support does not mean buy immediately; wait to see what price does at the key level, then react and trade.
Install to Summarize YouTube Videos and Get Transcripts
Explore YouTube Video Summarizer or Get YouTube Transcript Extractor
Questions & Answers
Q: What is the core concept behind this price action trading strategy?
The strategy is based on momentum loss read through candlestick shifts and sizes. As price approaches a key support or resistance level, you want to see candlesticks getting smaller and smaller, which shows the buyers or sellers are losing momentum and steam. This slowing signals that price is likely to reverse off the level rather than break through it, creating a high win-rate reversal setup.
Q: How do you identify key support and resistance levels?
A strong support level is where price repeatedly hits and reverses back up from. A strong resistance level is where price repeatedly fails to break past and ends up reversing and heading back down. You mark these major levels first, before doing anything else, so you know where to look for buys and sells. Price reversing off the same area two or more times confirms the level is significant.
Q: What candlestick signals confirm a reversal at a key level?
Look for reversal candlesticks such as a doji, a small long-wick candle rejecting support, or multiple long wick candles that show price is not breaking past the level. At support, these signal a buy entry. Another confirmation is a color change: after many green candles pushing up, a red bearish engulfing candle at resistance signals a reversal back down, indicating momentum has flipped.
Q: Where should you place stop loss and take profit?
Place your stop loss a few pips below the key support level you are buying from. Place your take profit at the next key level, such as a strong resistance level above. The creator trades from one key level to the next key level, so entries are made at one level and exits are targeted at the following major support or resistance in the direction of the trade.
Q: When should you avoid entering a reversal trade?
Avoid entering when candlesticks stay big at a key level instead of shrinking. If price approaches resistance with a big fat green candle, buyers are in control and price is gaining momentum, so it will likely burst through rather than reverse. Similarly, big red candles piercing support show sellers are in control and price will crumble downward, so do not buy that support.
Q: Why is reacting to the market better than predicting it?
Trading is not about predicting the future; it is about reacting to what the market and price action show you. Just because you see a green candle at a key support level does not mean you must buy immediately. You always want to wait and see what price is actually doing at the key level, get confirmation, and then react and trade from there rather than imposing your thoughts on the market.
Q: What is the significance of a candlestick color change at a key level?
A color change in the candlesticks at a key support or resistance level is a pro tip signal of shifting momentum. As price rises you may see eight green candles in a row showing bullish momentum, and then a red bearish engulfing candle appears at resistance, signaling reversal. At support, seeing black or red candles shift to green candles shows buyers are entering and pushing price up.
Q: How did the creator apply this strategy to trade gold?
The creator marked a major support level as gold fell in a downtrend, then dropped to lower timeframes like the one hour to spot momentum loss. Small candlesticks and a long wick candle rejected a minor support, and candles changed color toward green, showing buyers entering. Waiting for confirmation, he entered on a break of a consolidation box and hit take profit, making over nine thousand dollars in a few hours.
Summary & Key Takeaways
-
The strategy is built on momentum loss read through candlestick shifts and sizes. Start by marking major support and resistance levels where price has repeatedly reversed. At those levels, watch for candles shrinking progressively, which shows the dominant side is losing momentum and a reversal is likely.
-
Confirmation comes from reversal candles. At support, a long-wick rejection candle followed by a doji signals a buy, while multiple long wick candles rejecting a level show price refuses to break through. A color change, green appearing at support or a red bearish engulfing at resistance, strengthens the signal.
-
Avoid setups where candles stay big at a level, since that means strong momentum and a likely breakout, not a reversal. React to price rather than imposing predictions. The creator applied this to gold on lower timeframes, waited for confirmation, and made over nine thousand dollars, roughly ten thousand.
Read in Other Languages (beta)
Share This Summary 📚
Summarize YouTube Videos and Get Video Transcripts with 1-Click
Try YouTube Summary with ChatGPT & Claude or YouTube Transcript Generator
Explore More Summaries from The Trading Geek 📚





Summarize YouTube Videos and Get Video Transcripts with 1-Click
Try YouTube Summary with ChatGPT & Claude or YouTube Transcript Generator