In 6 Months, It's All Over.
In 6 Months, It's All Over.
Transcript
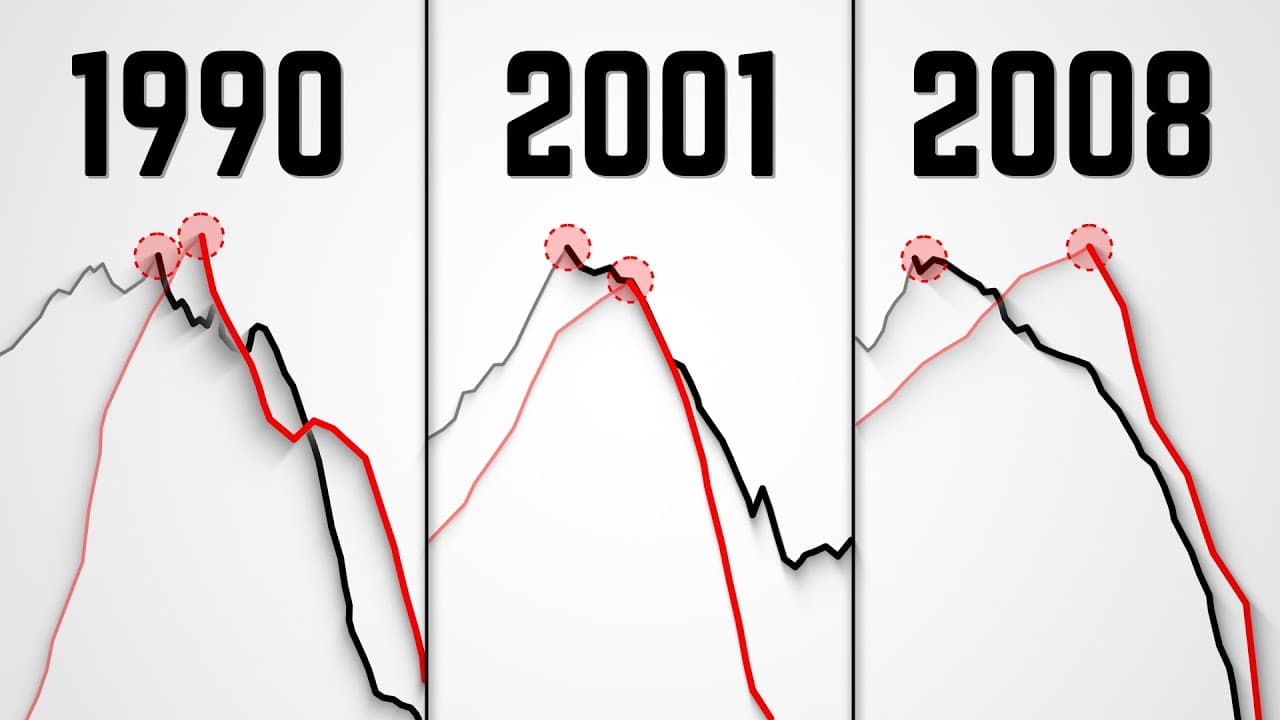
This chart shows us the aggregate economy index. We can put red dots at the exact peaks and troughs of this index and see that these line up exactly with the start and end dates of recessions as classified by the National Bureau of Economic Research. On average, the stock market peaks a few months before the start of economic recessions, which mean... Read More
Install to Summarize YouTube Videos and Get Transcripts
Explore YouTube Video Summarizer or Get YouTube Transcript Extractor
Read in Other Languages (beta)
Share This Summary 📚
Summarize YouTube Videos and Get Video Transcripts with 1-Click
Download browser extensions on:
Try YouTube Summary with ChatGPT & Claude or YouTube Transcript Generator
Explore More Summaries from Bravos Research 📚

The Next 6 Months Will Make History.
Bravos Research

The Next 3 Months Will Be Massive for Bitcoin.
Bravos Research

The Global Financial System is Breaking…
Bravos Research
You're Not Ready For What's Coming Next.
Bravos Research
Why Are Rising Bond Yields a Risk for Investors?
Bravos Research

A $37 Trillion Currency Reset Just Started…
Bravos Research
Summarize YouTube Videos and Get Video Transcripts with 1-Click
Download browser extensions on:
Try YouTube Summary with ChatGPT & Claude or YouTube Transcript Generator