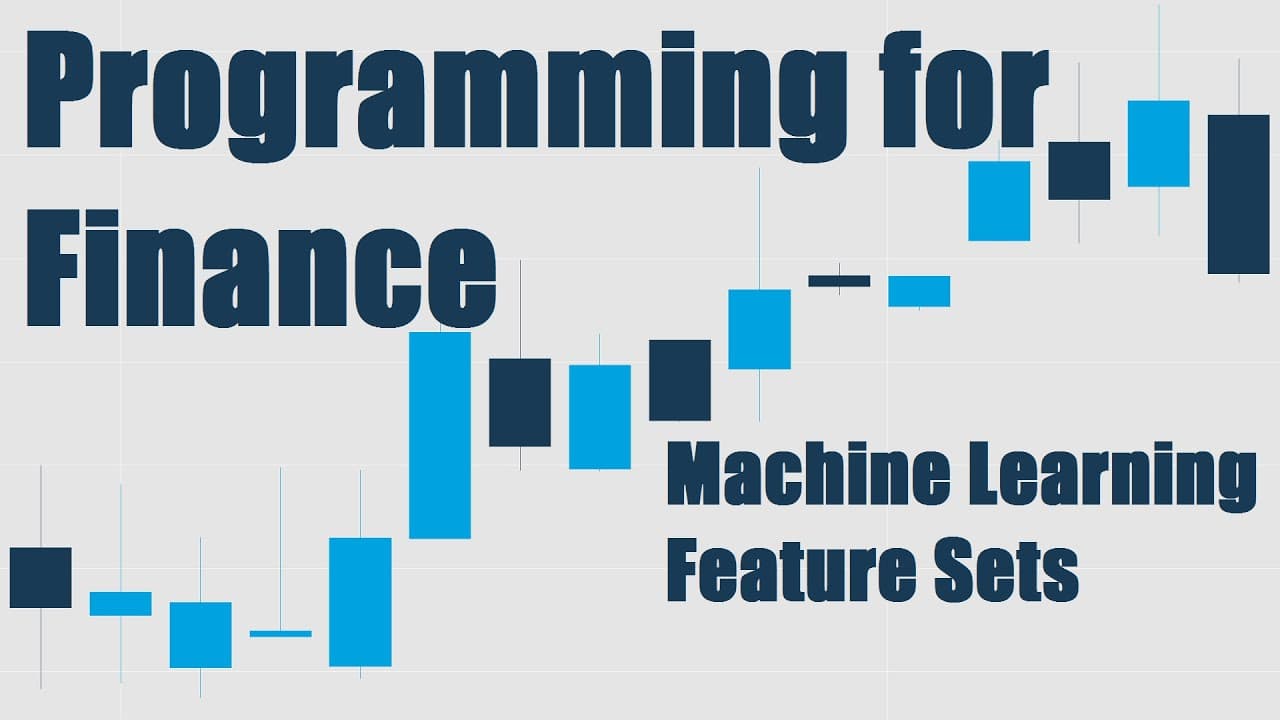
Creating Machine Learning Classifier Feature Sets - Python for Finance 15
TL;DR
Feature sets for a stock-price classifier are created by using each day’s current and previous nine prices as a 10-price window, then labeling whether the subsequent price rose or fell. The tutorial also explains list-index boundaries, feature scaling between negative 1 and positive 1, preprocessing, and exception handling during feature creation. Read on for the precise windowing and labeling logic.
Transcript
what is going on everybody welcome to another Python with finance tutorial video in this video we're just gonna pick up where we left off and that is the creating of these feature sets the idea here is for every day in this history of a hundred days we're going to take that day the previous 10 days and then the way what we're gonna do is we're gonn... Read More
Key Insights
- 🎰 The tutorial focuses on using machine learning to analyze historical stock prices and predict future prices.
- 🥳 Creating feature sets involves taking the previous 10 days' prices and labeling them based on whether the price increased or decreased on the following day.
- ❓ Normalizing the data is important to compare and analyze different stocks.
Install to Summarize YouTube Videos and Get Transcripts
Explore YouTube Video Summarizer or Get YouTube Transcript Extractor
Questions & Answers
Q: How do you create machine learning classifier feature sets for stock prices in Python?
For each eligible day, take its price together with the previous nine prices to form a 10-price feature window. Compare the last price in that window with the subsequent price, then assign a label indicating whether the price rose or fell.
Q: What does each stock-price feature window contain?
Each feature window contains 10 historical prices: the price for the selected day and the previous nine prices. The changes across those prices give the machine learning model a pattern it can associate with the next movement.
Q: How are rising and falling prices labeled for training?
A price increase can be labeled 1. A decrease can be labeled negative 1, although the tutorial notes that zero could also be used and that the precise choice is flexible.
Q: Why does feature creation begin at a start bar instead of the first price?
The process needs prices from 10 days to build each feature window. Starting at the first list element would make it impossible to retrieve the required earlier prices, so iteration begins at a designated start bar.
Q: Why does the loop stop at the price-list length minus one?
The loop needs access to the price after the current feature window so it can determine whether the price rose or fell. It also accounts for the difference between a list’s length and zero-based indexing, where the first element is at index zero.
Q: What are the start price and end price in the labeling process?
The start price is the last price inside the 10-price window, accessed at the current bar. The end price is the subsequent value, accessed at bar plus one, and comparing them determines the training label.
Q: Why are machine learning features kept between negative 1 and positive 1?
The tutorial says machine learning features generally work best when placed between negative 1 and positive 1. Using 1 and negative 1 as labels fits that range, while preprocessing is used to help ensure the data conforms to it.
Q: How are errors handled while creating the feature sets?
Feature creation is placed inside a try-and-except block so an exception does not prevent all features from being produced. The exception message is printed with a “feature creation” identifier, helping locate errors such as non-numeric values within the loop.
Summary & Key Takeaways
-
The video tutorial discusses the process of creating feature sets for analyzing stock prices.
-
The feature sets are created by taking the previous 10 days' prices and determining whether the price increased or decreased on the following day.
-
Machine learning algorithms are used to analyze the pattern of price changes and predict future prices.
Read in Other Languages (beta)
Share This Summary 📚
Summarize YouTube Videos and Get Video Transcripts with 1-Click
Try YouTube Summary with ChatGPT & Claude or YouTube Transcript Generator
Explore More Summaries from sentdex 📚
Summarize YouTube Videos and Get Video Transcripts with 1-Click
Try YouTube Summary with ChatGPT & Claude or YouTube Transcript Generator