How to Use the 50 EMA When Trading GBPJPY
TL;DR
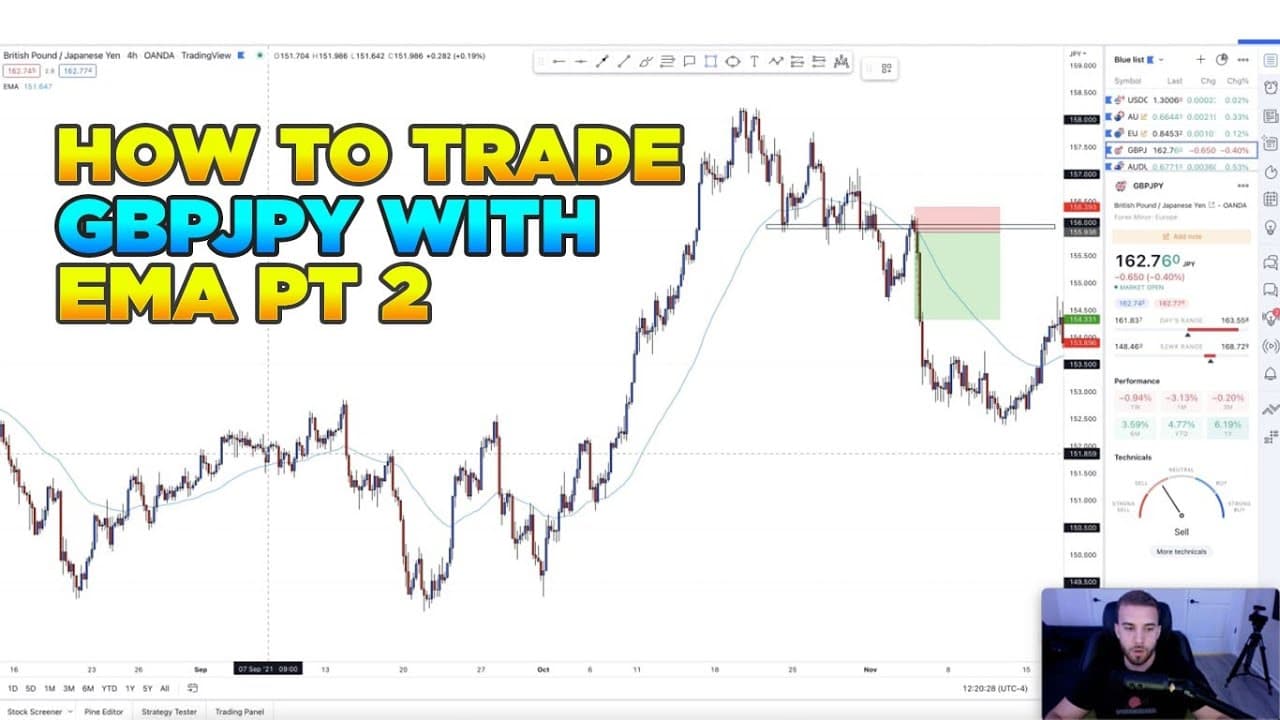
Use the 50 EMA as dynamic support or resistance and as additional confirmation, never as the sole reason for entering or rejecting a GBPJPY trade. Prioritize market structure, trend, price levels, and candlestick signals, especially on higher time frames, while using lower-time-frame EMA position to strengthen an existing trade idea.
Transcript
all right what's up guys welcome back to another video so in this video we're gonna be talking about how i use my ema part two so if you guys haven't seen part one make sure to go click the link in the description below and i assure you guys kind of like an introduction to it this is like a little more advanced um it's very simple everybody complic... Read More
Key Insights
- The indicator is a 50 EMA that uses the closing price as its source, has an offset of zero, and remains visible on every time frame. Its interpretation changes with the selected time frame, although its basic support-and-resistance function remains consistent.
- The 50 EMA is an added confluence rather than a complete trading system. It may increase confidence in an existing setup, but the presenter says it does not independently determine profitability, create winning trades, or provide a reason to ignore other market evidence.
- An EMA works as dynamic support and resistance in this approach. When price is above it, the line can act as support, and when price is below it, the line can act as resistance, similar to manually marked horizontal support and resistance levels.
- Market structure is more important than EMA alignment on weekly and daily charts. The presenter considers EMA position largely irrelevant on these higher time frames because the actual trend, structural levels, and visible price behavior provide stronger information for deciding trade direction.
- Lower time frames make EMA behavior more relevant because price moves across the line more frequently. On four-hour, two-hour, and one-hour charts, the preferred condition is price above the EMA for buys and below the EMA for sells.
- A valid trade can oppose the EMA position on one or more time frames. The featured sell was supported by former support becoming resistance and a bearish engulfing candlestick, even though price was above the EMA on the one-hour and two-hour charts.
- Confluence trading requires several compatible reasons for entering a position. The presenter compares the EMA to one specification on a desired car: it can improve the overall setup, but its presence or absence should not independently make or break the decision.
- Overreliance on the EMA can distort analysis by causing a trader to overlook what the market is doing. The presenter is considering trading without it and says that simpler charts centered on market structure and a limited number of marked levels can be sufficient.
Install to Summarize YouTube Videos and Get Transcripts
Explore YouTube Video Summarizer or Get YouTube Transcript Extractor
Questions & Answers
Q: How should traders use the 50 EMA on GBPJPY?
Traders should use the 50 EMA as dynamic support or resistance and as confirmation for a setup already supported by market structure. Price above the EMA can strengthen a buy idea, while price below it can strengthen a sell idea. The EMA should not independently determine the trade because structural levels, trend, and price-action signals may provide stronger evidence.
Q: What 50 EMA settings are used in this strategy?
The strategy uses a 50 EMA with the closing price selected as the source and an offset of zero. The presenter keeps it visible on every time frame because it can be interpreted differently as the chart changes. Style settings mainly control its appearance and do not change the central method of treating the EMA as dynamic support or resistance.
Q: Does the 50 EMA act as support and resistance?
The 50 EMA acts as a moving, dynamic level of support and resistance in the method described. When price trades above the EMA, the line can serve as support. When price trades below it, the line can serve as resistance. This resembles the way a manually marked horizontal level may alternate between support and resistance after price crosses it.
Q: Which time frames matter most when trading with the EMA?
The EMA is more useful to the presenter on lower time frames such as the four-hour, two-hour, and one-hour charts. Weekly and daily EMA positions receive less weight because market structure and the broader trend take priority there. Lower-time-frame price moves faster, so the EMA shifts between support and resistance more frequently and can provide more detailed confirmation.
Q: Should price be above the EMA for buys and below it for sells?
The preferred alignment is price above the EMA when buying and below the EMA when selling because that alignment can provide confidence that the trade follows the trend. However, it is not an absolute entry requirement. A setup may still be valid when stronger factors, including market structure, support and resistance, or a candlestick entry signal, conflict with the EMA position.
Q: Can a trade be taken when the EMA conflicts with its direction?
A trade can be taken when EMA alignment conflicts with its direction if stronger chart evidence supports the setup. The presenter describes a sell in which price was above the EMA on the one-hour and two-hour charts but below it on the four-hour chart. Former support acting as resistance and a bearish engulfing candle supported the sell despite mixed EMA readings.
Q: Why should the EMA not determine a trade by itself?
The EMA should not determine a trade by itself because its signals can differ across time frames and distract from actual market structure. The same setup may appear above the EMA on one chart and below it on another. Treating the indicator as only one confluence helps prevent a trader from dismissing clear support, resistance, trend, or candlestick evidence.
Q: What are the risks of relying too heavily on the 50 EMA?
Relying too heavily on the 50 EMA can cause a trader to overlook what price and market structure are showing. The presenter says this reliance has affected his trading and is one reason he is transitioning toward using the indicator less. The description also warns that foreign exchange trading is highly speculative, can be volatile, and may result in losing some or all invested funds.
Summary & Key Takeaways
-
The strategy uses a 50 EMA configured with the closing price as its source, zero offset, and visibility across every time frame. Price above the EMA can treat it as dynamic support, while price below it can treat it as dynamic resistance, but this relationship is only one component of trade analysis.
-
Market structure takes priority over EMA position, particularly on weekly and daily charts. A trade can remain valid even when the EMA appears to conflict with its direction, provided stronger evidence exists, such as a former support level becoming resistance, a bearish engulfing candle, or a clear structural trend.
-
On four-hour, two-hour, and one-hour charts, the EMA changes roles more frequently because these time frames move faster. The preferred alignment is price above the EMA for a buy and below it for a sell, but traders should avoid dismissing stronger chart evidence merely because this preferred alignment is absent.
Read in Other Languages (beta)
Share This Summary 📚
Summarize YouTube Videos and Get Video Transcripts with 1-Click
Try YouTube Summary with ChatGPT & Claude or YouTube Transcript Generator
Explore More Summaries from fxalexg 📚





Summarize YouTube Videos and Get Video Transcripts with 1-Click
Try YouTube Summary with ChatGPT & Claude or YouTube Transcript Generator