How Do Elections Affect the Indian Stock Market?
TL;DR
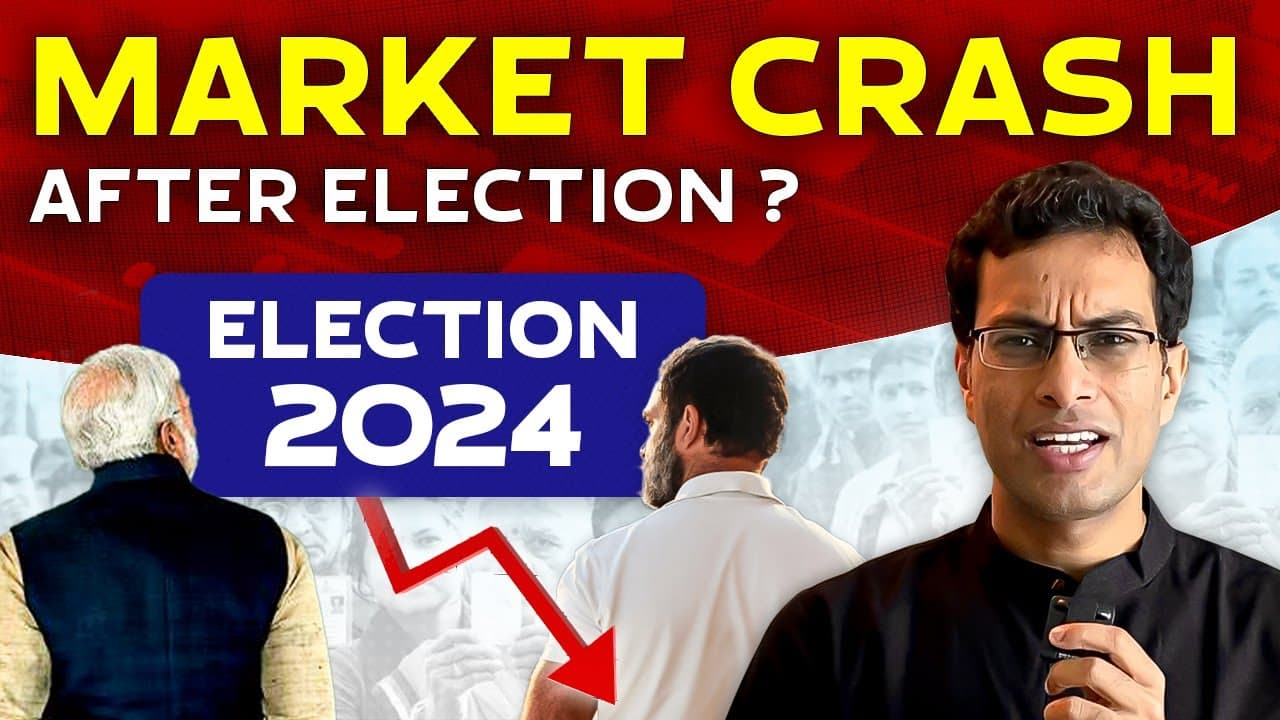
Remaining invested is presented as more sensible than exiting solely because of election uncertainty, provided market prices remain fair or reasonable. Historical examples suggest unexpected results can cause sharp short-term corrections, but subsequent recovery is possible. Investors should also consider Nifty valuations and conditions in the highly correlated US market, where the cited price-to-earnings ratio is near the upper end of its usual range.
Transcript
Hi, everyone. So on today's video, I'm going to discuss what is going to happen in the stock market once the elections are over. Now, this is not a prediction video. This is an analysis video. So I will show you data, charts. Graphs help you understand and parse through the data. And this is a data driven analysis. That's the point. Of course.... Read More
Key Insights
- Election surprises can cause sharp short-term market declines because prices incorporate expectations before official results arrive. The 2004 election is cited as an example, with Congress winning despite expectations of a BJP victory, followed by a 9% three-day correction and a 17% decline.
- The 2004 market decline was recovered within one year, according to the historical comparison presented. This example supports separating the immediate reaction to an unexpected political outcome from the market's longer-term performance, especially when making decisions with a twelve-month investment horizon.
- Historical election returns require economic context because election results are not the only force affecting prices. The 2009 performance followed the 2008 US subprime mortgage crisis, when the market had already corrected by 66%, while the one-year decline associated with 2019 included the COVID correction.
- The average post-election market gain in the presented compilation is 27% across situations involving a change in government or continuation by the incumbent party. The analysis uses this historical average to support staying invested, while also acknowledging that historical patterns do not guarantee a particular outcome.
- The Nifty price-to-earnings ratio had consolidated for roughly 2.5 years and was characterized as neither overvalued nor undervalued. This valuation assessment underpins the view that long-term investors need not avoid the market solely because election-related uncertainty may create temporary volatility.
- Election expectations can already be reflected in market prices before official results are announced. The analysis says the market expected a BJP victory and suggests indications may become clearer about one week beforehand, making that period especially important for swing traders monitoring short-term positioning.
- Indian and US stock markets are described as strongly correlated because the US dollar is the world's reserve currency and is used in roughly 60% to 70% of global trade. The 2008 US-originated crisis is cited as evidence that shocks beginning in America can severely affect Indian equities.
- US equity valuations were near the higher end of their cited range, with a price-to-earnings ratio around 28 versus a typical median near 18 and a range of 20 to 28. Therefore, an assessment of Indian market risk should include US valuations rather than focusing only on domestic elections.
Install to Summarize YouTube Videos and Get Transcripts
Explore YouTube Video Summarizer or Get YouTube Transcript Extractor
Questions & Answers
Q: How could election results affect the Indian stock market?
Election results can affect the market by confirming or contradicting expectations already incorporated into prices. A result matching the expected BJP victory could produce a rally, while an unexpected Congress victory could create short-term pain. The historical example from 2004 shows that a surprise outcome was followed by a 9% correction over three days and a 17% decline, although that fall was recovered within one year.
Q: Should investors exit Indian stocks before election results?
The analysis argues that investors should not exit solely because they fear election volatility, particularly when they have at least a twelve-month perspective and can buy at fair or reasonable prices. It distinguishes investors from short-term traders, who may need to watch market indications closely during the week before results. Historical recovery after the 2004 surprise is offered as support for maintaining a longer horizon.
Q: What happened to the Indian market after the 2004 election?
In 2004, the market expected the BJP to win, but Congress came to power. The unexpected result created a short-term shock, including a 9% correction over three days and a decline described as 17%. According to the transcript, the entire fall was recovered within one year. The example illustrates how an election surprise can hurt prices immediately without determining the market's full-year outcome.
Q: Why should election-year market returns be viewed in context?
Election-year returns can overlap with major economic events that have little to do with voting. The 2009 market was in a recovery phase after the 2008 US subprime mortgage crisis and a 66% correction. Likewise, the one-year fall associated with 2019 included the COVID correction. These examples make it difficult to attribute subsequent market performance entirely to the election result or the winning party.
Q: Was the Nifty considered overvalued before the election?
The Nifty was characterized as neither overvalued nor undervalued. Its price-to-earnings ratio had been consolidating for roughly 2.5 years, which the analysis used to reject the claim that Indian equities were broadly trading at rich valuations. However, fair aggregate valuation does not eliminate election volatility, and the suggested approach is to evaluate market price alongside the result expected by investors.
Q: What should swing traders watch before election results?
Swing traders should pay particular attention to market behavior approximately one week before the official result. The analysis suggests that prices may begin indicating how participants expect the election to conclude before confirmation arrives. Because short-term positions are sensitive to surprises, traders are advised to be very careful during this period, while long-term investors are encouraged to focus more on valuation and a twelve-month outlook.
Q: Why does the US stock market matter to Indian investors?
The Indian market is described as highly correlated with the US market because the United States issues the world's reserve currency and roughly 60% to 70% of global trade occurs in US dollars. The 2008 crisis began in the United States but severely affected India as well, with the Sensex falling by roughly the same amount cited for the US market. Domestic election analysis therefore cannot stand alone.
Q: What did the analysis say about US market valuation?
The US market's price-to-earnings ratio was cited near 28, down from close to 41 in 2021 after an aggressive correction. The usual median was described as approximately 18, with a range from 20 to 28. On that basis, the US market was considered to be toward the higher end of its valuation range, which adds an external risk factor for Indian equities.
Summary & Key Takeaways
-
Election outcomes can produce immediate volatility when results differ from expectations. In 2004, the market expected a BJP victory, but Congress came to power, followed by a 9% correction over three days and a 17% decline. The transcript says the entire fall was recovered within one year, highlighting the difference between trading and investing horizons.
-
The analysis characterizes the Nifty price-to-earnings ratio as neither clearly overvalued nor undervalued after roughly 2.5 years of consolidation. It argues that the expected BJP victory was already reflected in prices, so the market response would depend on whether the result confirmed or contradicted that expectation and how strongly the winning party formed the government.
-
Indian equities cannot be evaluated through election results alone because the Indian and US markets are described as highly correlated. The US market's price-to-earnings ratio was cited near 28, compared with a typical median near 18 and a range of 20 to 28, placing valuations toward the range's higher end.
Read in Other Languages (beta)
Share This Summary 📚
Summarize YouTube Videos and Get Video Transcripts with 1-Click
Try YouTube Summary with ChatGPT & Claude or YouTube Transcript Generator
Explore More Summaries from Akshat Shrivastava 📚
![Why long-term Investing works only FOR THE RICH now? [Instead do MID-TERM investing] thumbnail](/_next/image?url=https%3A%2F%2Fi.ytimg.com%2Fvi%2F3V6i73NCWsc%2Fhqdefault.jpg&w=750&q=75)


Summarize YouTube Videos and Get Video Transcripts with 1-Click
Try YouTube Summary with ChatGPT & Claude or YouTube Transcript Generator