Is the AI Stock Rally Facing a Market Correction?
TL;DR
A further full-bodied decline on Monday would confirm the speaker's bearish technical signal and could point toward the S&P 500's 100-day moving average near 6,300, with a roughly 10% NASDAQ correction also considered possible. Friday's selloff followed an extended 40% rally from April, unusually low volatility, and renewed concern about Chinese rare-earth export controls and potential additional US tariffs.
Transcript
Well, it finally happened. 33 days the S&P went without dropping at least 1% and on Friday the S&P dropped 2 1/2%, the NASDAQ dropped 3 and 12%. So, obviously the question on everybody's mind is this the start of the AI bubble burst. Is this the start of something greater than just a typical pullback? Everyone watching this is likely worried about ... Read More
Key Insights
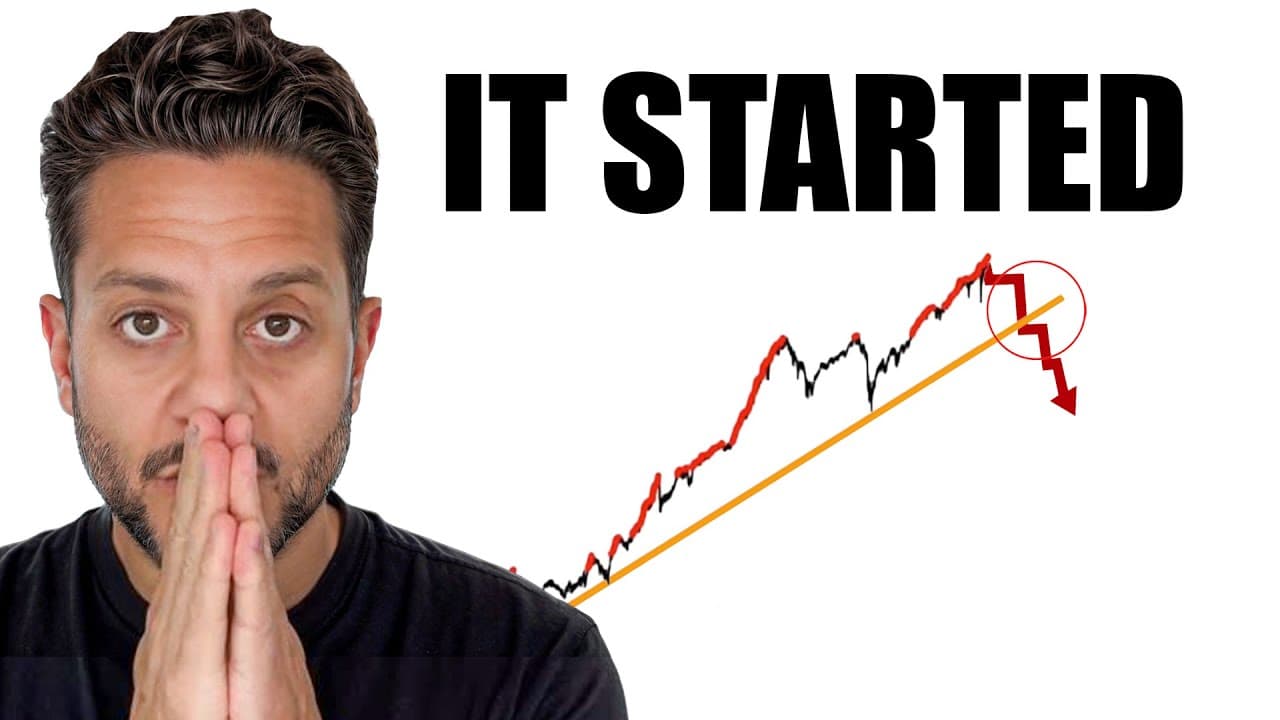
- The Friday selloff ended a 33-day period in which the S&P 500 had avoided any decline of at least 1%. The index fell 2.5%, while the NASDAQ fell 3.5%, raising concerns that an overdue pullback might be developing into a larger correction.
- The S&P 500 had risen 40% from its April bottom to its all-time high. The speaker argues that such an extended advance can become vulnerable to mean reversion even without a fundamental catalyst, especially after August and September pass without significant declines.
- Rare-earth export controls became the immediate catalyst for the selloff. Trump described China's measures as unacceptable and contemplated an additional 100% tariff by November 1, while also considering canceling a meeting with President Xi before later saying the meeting might proceed.
- Rare earths are important to US national security because they are used in F-35 fighter jets, submarines, lasers, satellites, Tomahawk missiles, and other systems. The speaker highlights US dependence on Chinese production and processing as a significant strategic vulnerability.
- The VIX rose 32% in one day after coiling during an extended period of market complacency. The speaker says tightly compressed volatility and steadily rising asset prices made the market unusually susceptible to a major headline that might otherwise have caused less damage.
- A confirmed trend-line break has historically preceded declines of at least 5% in the examples presented. The NASDAQ examples included drops of 25%, 15%, 7%, and 11%, while the S&P examples included declines of 19%, 8%, 5%, 10%, 7%, and 16%.
- The S&P 500 has touched its 100-day moving average during August through October every year discussed except 2009. That moving average was near 6,300 at the recording date, representing an estimated 6.5% decline from the market's recent peak.
- The weekly S&P 500 chart contains an unfilled gap between 5,600 and 5,800. The speaker considers a near-term decline to that area unlikely, but notes that reaching it would represent approximately a 14% to 15% drop and would still not constitute a bear market.
Install to Summarize YouTube Videos and Get Transcripts
Explore YouTube Video Summarizer or Get YouTube Transcript Extractor
Questions & Answers
Q: Why did the S&P 500 and NASDAQ fall so sharply?
The selloff followed both an extended rally and a new tariff-related catalyst. The S&P 500 had gone 33 days without falling at least 1% and had risen 40% from its April bottom to its all-time high. Markets then reacted to Trump's warning about a possible additional 100% tariff on China in response to Chinese rare-earth export controls.
Q: Does the selloff mean the AI market bubble is bursting?
The speaker does not conclude that an AI bubble has definitively burst. Instead, the decline is presented as a potentially overdue pullback after a 40% S&P 500 advance and a long period without meaningful mean reversion. Monday's price action is treated as the more important confirmation signal for determining whether the decline could become a broader correction.
Q: Why are China's rare-earth export controls important to US markets?
Rare earths are used in consumer and medical products such as televisions, LED lights, and MRI scanners, but the speaker emphasizes their military importance. They are required for F-35 fighter jets, submarines, lasers, satellites, and Tomahawk missiles. China dominates much of the relevant production and processing, creating a strategic vulnerability for the United States.
Q: What would confirm a larger stock market correction?
A further red session on Monday, October 13, would be the key confirmation according to the speaker. The decline would need to produce a full-bodied lower close rather than merely an intraday wick followed by a recovery. Such price action would confirm the apparent trend-line breaks on both the NASDAQ and S&P 500 and increase the probability of deeper losses.
Q: How far could the S&P 500 fall after the trend-line break?
The speaker's primary S&P 500 target is the 100-day moving average near 6,300. Reaching that level would represent an estimated 6.5% decline from the recent peak, which is described as a respectable pullback rather than a correction. A deeper move toward the weekly gap between 5,600 and 5,800 is considered possible but unlikely during this particular decline.
Q: How far could the NASDAQ fall if weakness continues?
If Monday produces another decisive lower close, the speaker believes the NASDAQ could enter correction territory with a decline of roughly 10% or more. For QQQ, the cited Fibonacci level is around 548. The NASDAQ is expected to fall more sharply than the S&P 500 because its market structure is described as more concentrated.
Q: What does the VIX increase indicate about market conditions?
The VIX rose 32% in one day after remaining quiet and coiling tightly. According to the speaker, this reflected a market that had become complacent while asset prices climbed without sufficient mean reversion. Such conditions can make markets highly sensitive to major headlines, producing a more destructive reaction than similar tariff news generated earlier in the rally.
Q: What should leveraged traders do during this volatility?
The speaker warns that traders should avoid holding too many leveraged positions during the seasonally volatile August through October period. Friday's sharp decline illustrates why leverage can become especially dangerous when volatility suddenly expands. Although the transcript ends before the complete risk-management discussion, the stated approach is to reduce excessive leveraged exposure rather than assume the established upward trend will immediately resume.
Summary & Key Takeaways
-
The S&P 500 fell 2.5% and the NASDAQ fell 3.5% on Friday after 33 days without an S&P decline of at least 1%. The speaker argues that a pullback was already overdue because the S&P had climbed 40% from its April bottom to its all-time high without meaningful mean reversion.
-
The immediate catalyst was a dispute concerning China's rare-earth export controls. Trump discussed an additional 100% tariff on China by November 1 and possibly canceling a meeting with President Xi. China later said the controls were not a complete export ban, their impact should be limited, and dialogue remained possible.
-
The technical outlook depends heavily on Monday, October 13. Another decisive lower close could confirm broken NASDAQ and S&P trend lines. The speaker then expects the S&P to approach its 100-day moving average near 6,300 and believes the NASDAQ could enter correction territory, while warning leveraged traders to reduce risk.
Read in Other Languages (beta)
Share This Summary 📚
Summarize YouTube Videos and Get Video Transcripts with 1-Click
Try YouTube Summary with ChatGPT & Claude or YouTube Transcript Generator
Explore More Summaries from The Traveling Trader 📚



Summarize YouTube Videos and Get Video Transcripts with 1-Click
Try YouTube Summary with ChatGPT & Claude or YouTube Transcript Generator