Why Did Tariff Relief Trigger a Historic Rally?
TL;DR
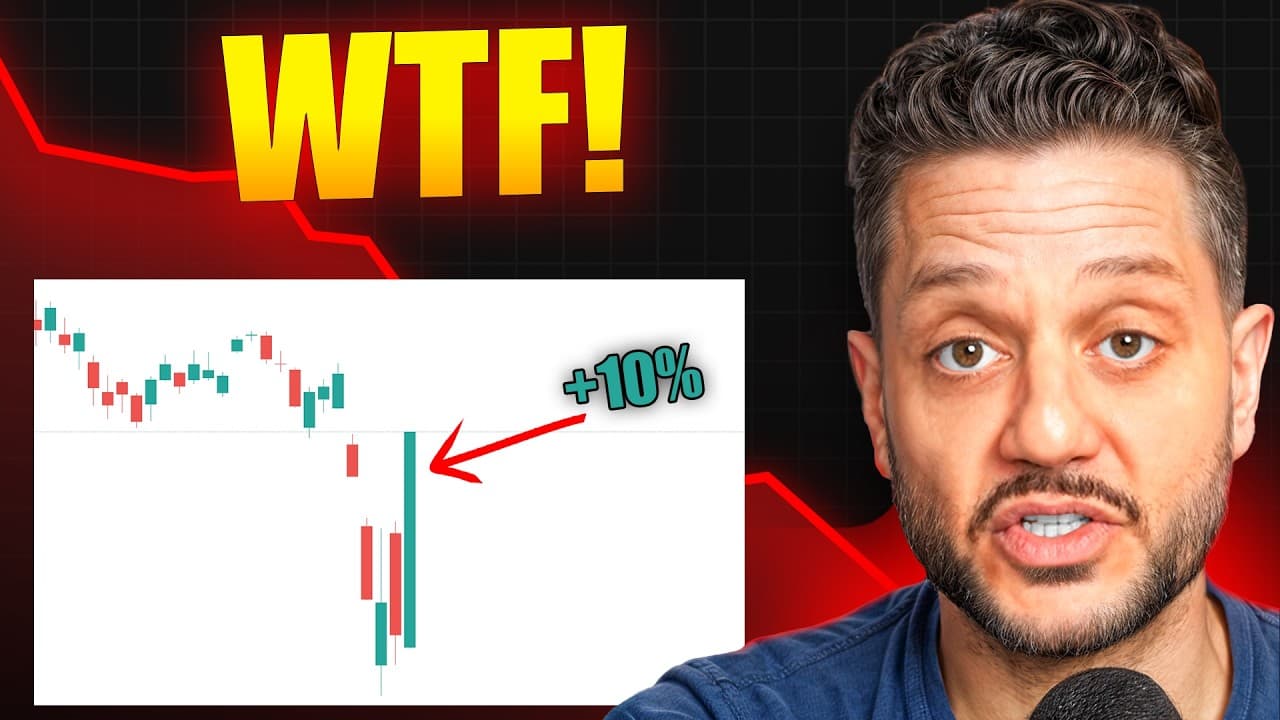
The tariff pause triggered a historic stock rally, but the surge does not prove that the market has reached its bottom. The administration reduced tariffs to 10% for most countries for 90 days after Treasury yields rose sharply, with the 30-year yield reaching 5%. History suggests that exceptionally strong trading days usually occur during troubled markets rather than healthy ones.
Transcript
The S&P 500 just had a 10% day. The Nasdaq had a 12% day. This ranks as the ninth best day ever by percentage in the S&P 500 and the second best day ever in the NASDAQ. This stuff does not happen in healthy markets, so don't be under any illusion here. But we're definitely going to talk about it. It was also the single best day in my portfolio. I'm... Read More
Key Insights
- The S&P 500 gained 9.52% and the Nasdaq gained 12.16%, placing the session among the strongest percentage advances in their histories. Such extraordinary gains are presented as features of distressed, highly volatile markets rather than evidence of a healthy and stable environment.
- The tariff pause reduced rates to 10% for most countries other than China for 90 days. Markets welcomed the announcement because tariff news had driven substantial selling, while valuations in companies such as Google and Amazon had fallen to levels described as unseen for years.
- The bond market was the administration's central concern, according to the analysis. Falling equity prices were tolerated while Treasury yields declined, but policy changed after Treasury selling caused long-term yields to rise sharply and threatened a more consequential disruption in lending and the wider economy.
- The 10-year Treasury yield reversed from approximately 3.89% and moved toward 4.5%. This reversal mattered because the administration had repeatedly emphasized lowering yields, making the sudden increase a sign that its tariff strategy was producing the opposite financial effect.
- The 30-year Treasury yield reached 5%, a level characterized as emergency territory. The move was especially concerning because the 30-year Treasury was described as one of the world's safest assets, and a poorly received bond auction scheduled for April 10 could have pushed yields higher.
- Treasury selling may have included international and retaliatory activity, with China and Japan identified as the two largest individual foreign holders in the discussion. Investors also demanded higher yields because they feared recession, inflation, and weakening international willingness to conduct business with the United States.
- The strongest stock-market days commonly occur during major crises and bear markets. The historical examples cited include the Great Depression, the Great Financial Crisis, the pandemic, and the 1987 crash, showing why one exceptional rally cannot independently confirm a durable market bottom.
- March 24, 2020 was the only session among the highlighted top-performing days that also marked the market bottom. That exception followed the announcement of a massive stimulus bill, while the tariff pause described here lacked an equivalent confirmed catalyst for declaring that the broader decline had ended.
Install to Summarize YouTube Videos and Get Transcripts
Explore YouTube Video Summarizer or Get YouTube Transcript Extractor
Questions & Answers
Q: Why did the stock market rally after the tariff pause?
The market rallied because the administration reduced tariffs to 10% for most countries other than China for 90 days. Tariff announcements had previously driven heavy selling, so investors welcomed the temporary relief. The response produced a 9.52% gain in the S&P 500 and a 12.16% gain in the Nasdaq, making the session one of the strongest in each index's history.
Q: Did the historic rally confirm that the market had bottomed?
The rally did not confirm a market bottom. The historical sessions discussed show that exceptionally large gains usually happened amid the Great Depression, the Great Financial Crisis, the pandemic, or the 1987 crash. Only March 24, 2020 among the highlighted leading sessions coincided with the bottom, and that move followed the announcement of a massive stimulus bill.
Q: Why did rising Treasury yields influence the tariff decision?
Rising Treasury yields signaled that the tariff strategy was disrupting a market described as larger, more global, and more economically important than the stock market. The administration had tolerated falling stocks while yields declined. It changed course when widespread Treasury selling pushed yields upward, threatened lending conditions, and raised concerns about recession, inflation, and confidence in United States assets.
Q: What happened to the 10-year Treasury yield?
The 10-year Treasury yield initially fell to approximately 3.89%, its lowest cited level since October 2024, while the stock market declined. It then reversed sharply and moved toward 4.5%. Because the administration had emphasized bringing yields down, this reversal indicated that tariff policy was no longer producing its intended bond-market effect and instead risked worsening economic conditions.
Q: Why was a 5% yield on the 30-year Treasury alarming?
The 30-year Treasury was described as one of the safest assets in the world, so its yield reaching 5% suggested unusual stress and was characterized as emergency territory. The move was particularly concerning before a 30-year bond auction scheduled for April 10. Weak demand at that auction could have caused yields to rise even further, increasing pressure on lending markets.
Q: Why were investors selling Treasury bonds?
The analysis attributes Treasury selling to several possible forces. China and Japan, described as the two largest individual foreign bondholders, may have participated in retaliatory selling. Investors were also reconsidering the safety and attractiveness of long-term Treasuries because tariffs could have recessionary and inflationary consequences, while antagonistic business policies might weaken international willingness to transact with the United States.
Q: What do historically large market gains reveal about market health?
Historically large one-day gains often reveal severe volatility rather than healthy conditions. The leading S&P 500 sessions discussed were concentrated around the Great Depression, the Great Financial Crisis, the pandemic, and the 1987 crash. Since most did not occur at the final market bottom, a powerful rebound can happen while broader risks remain unresolved and additional losses are still possible.
Q: What market indicators should investors watch after the rally?
The key indicators identified are the 10-year and 30-year Treasury yields, rather than stock prices alone. If yields do not return toward the lower levels reached after Liberation Day, the tariff pause may only postpone further economic difficulty. Continued elevated yields would suggest that bond investors remain concerned about recession, inflation, Treasury demand, and confidence in United States economic policy.
Summary & Key Takeaways
-
The S&P 500 gained 9.52% while the Nasdaq rose 12.16%, ranking among their strongest sessions in history. The catalyst was a 90-day reduction of tariffs to 10% for most countries other than China. The rally followed a severe tariff-driven selloff that had pushed several major stocks toward unusually low valuations.
-
The administration appeared willing to tolerate falling stock prices while Treasury yields were also declining. Its position changed after widespread Treasury selling pushed the 10-year yield from 3.89% toward 4.5% and the 30-year yield to 5%. The bond-market disruption, rather than the equity decline alone, prompted the tariff pause.
-
Historical rankings show that most exceptionally large S&P 500 gains happened during the Great Depression, the Great Financial Crisis, the pandemic, or the 1987 crash. Among the top sessions discussed, only March 24, 2020 marked a market bottom, following the announcement of a massive stimulus bill. Therefore, another decline remains possible.
Read in Other Languages (beta)
Share This Summary 📚
Summarize YouTube Videos and Get Video Transcripts with 1-Click
Try YouTube Summary with ChatGPT & Claude or YouTube Transcript Generator
Explore More Summaries from The Traveling Trader 📚


Summarize YouTube Videos and Get Video Transcripts with 1-Click
Try YouTube Summary with ChatGPT & Claude or YouTube Transcript Generator