How to Swing Trade Chart Patterns in a Down Market
TL;DR
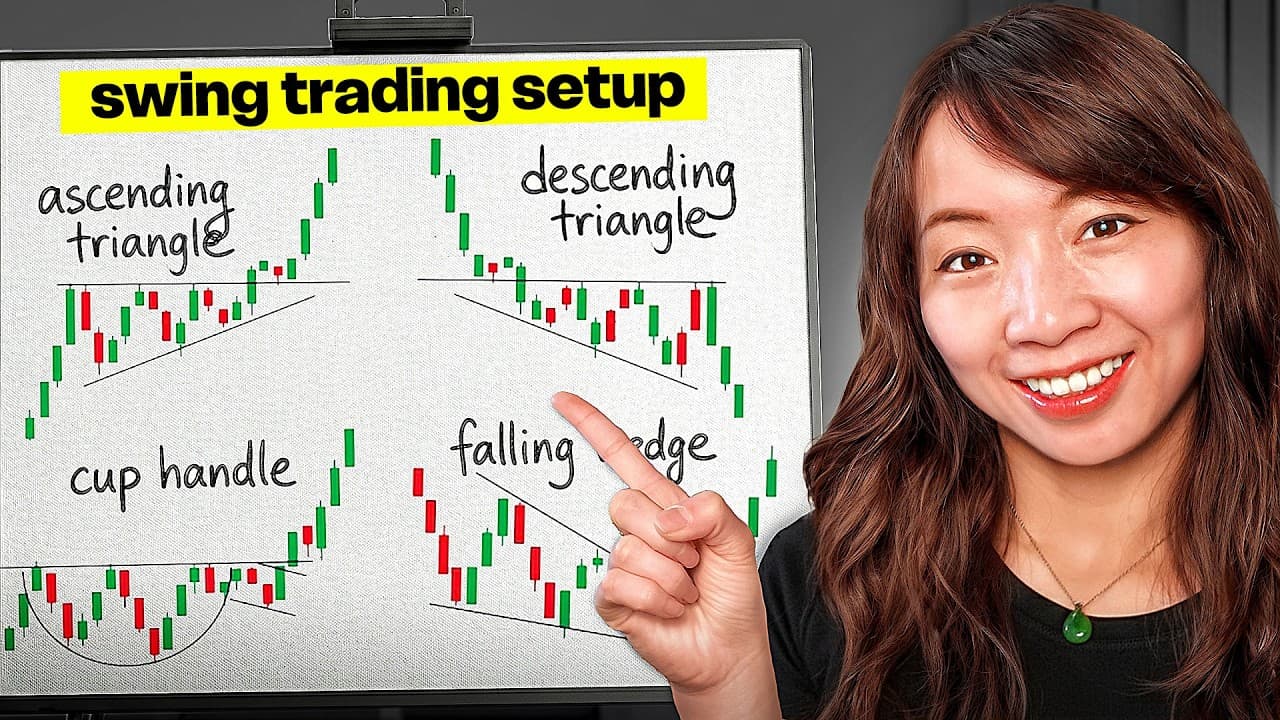
Wedge breakouts and long-term downtrend breaks are the patterns that still work when gap-ups and multi-day breakouts dry up, as they have during the S&P 500's correction. A wedge breakout needs one to three weeks of retested downtrend before price reclaims the 8 EMA and clears resistance. Long-term downtrend breaks target large caps above $800 million reclaiming the 200 SMA.
Transcript
What if I told you that just one simple candlestick chart pattern could transform your swing trading success? Imagine spotting a setup like this one, getting in early just as a pattern is forming, riding the wave, and then cashing out for massive gains once a stock actually breaks out. But here's the catch. Most traders miss these golden opportunit... Read More
Key Insights
- No strategy or chart pattern is guaranteed to work in all market conditions, which is why the pattern set has shifted toward setups that suit a bear market or general downtrend after gap-ups and multi-day breakouts became scarce over the last two months.
- Chart patterns are more reliable on the daily chart for large cap stocks in swing trading than intraday. Because swing positions are held for a longer period, the charts are more forgiving and there is more time to let a trade work out.
- The wedge breakout differs from a generic daily resistance breakout in that it requires breaking a downtrend that has been retested one to three times over one to three weeks, plus a break above resistance, rather than clearing resistance alone.
- Breakouts that include a few days of consolidation have a drastically higher success rate than one-day resistance breakouts, which is why consolidation candles riding the 8 EMA are preferred entries over a single extended breakout candle.
- The two indicators used on the daily chart for swing trading are the 200 SMA and the 8 EMA. Entries key off the stock reclaiming the 8 EMA while simultaneously breaking the daily downtrend line.
- Extended breakout candles are avoided as entries because chasing them gives poor risk to reward. The preferred entry is the first or second candle that closes above both the daily downtrend and the 8 EMA.
- Long-term downtrend breaks only apply to large cap stocks above $800 million market cap. Small caps below that threshold are dilutive and are not considered valid swing trading candidates for this pattern.
- A fundamental catalyst strengthens a long-term downtrend break. Intel's announcement of a new CEO experienced in the semiconductor industry was cited as transformative for a company beaten up by years of downtrend, supporting a move from $24 toward $28 to $30 or above.
Install to Summarize YouTube Videos and Get Transcripts
Explore YouTube Video Summarizer or Get YouTube Transcript Extractor
Questions & Answers
Q: What chart patterns work for swing trading in a down market?
Two patterns are highlighted for a bear or downtrending market: the wedge breakout and the long-term downtrend break. Both are used because gap-ups and multi-day breakouts have been scarce, with barely any good breakout swing trades found over the last two months while the S&P 500 entered correction territory. A third pattern is covered later in the video. The underlying idea is that when standard breakouts stop working, setups built around breaking an existing downtrend still offer opportunities if you are selective about where you look.
Q: How does a wedge breakout pattern work in swing trading?
A wedge breakout requires the stock to have a downtrend that has been retested one, two, or three times over at least a couple of days to a week, ideally one to three weeks. The wedge squeezes tighter and tighter until the stock reclaims the 8 EMA and breaks out above resistance. It is technically still a breakout, but the difference from a generic daily resistance breakout is that the downtrend line itself must break in addition to resistance. Other names for it include the triangle breakout, the rising wedge, or a simple downtrend break.
Q: When should you enter a wedge breakout trade?
Entry comes on the first or second candle that has broken out above the daily downtrend while riding above the 8 EMA, provided that downtrend was retested for at least a couple of days to a week beforehand. Candles that are too extended are avoided because getting in there is a chase with poor risk to reward. Consolidation candles riding along the 8 EMA as the wedge forms are the preferred setup, since breakouts that had time to consolidate have a drastically higher success rate than one-day resistance breakouts.
Q: What is the long-term downtrend break pattern?
The long-term downtrend break looks for stocks that have been in a downtrend for a year or more, trading below the 200 SMA, that start riding above the 8 EMA and then push up toward and through the 200 SMA. Intel was cited as an example, having trended down since the beginning of 2024, broken down through the 200 SMA, and then begun reclaiming it. The goal is to catch a reversal of a long-term trend rather than a short-term breakout, and it becomes stronger when a fundamental catalyst supports the turn.
Q: Why does the long-term downtrend break only apply to large cap stocks?
The pattern is restricted to large cap stocks and should not be used on small caps below the $800 million market cap level, because those smaller stocks are dilutive and are not considered suitable swing trading candidates. Dilution works against a multi-day or multi-week hold, so the setup is confined to bigger names where a genuine trend reversal can be sustained. Intel and Corsair are given as examples of large caps that fit the criteria.
Q: How do you set entries and stops for a long-term downtrend break?
The entry is taken right over the 200 SMA where an 8 EMA cross also synchronizes with a break of the downtrend line, ideally when the stock is already trending up toward or over the 200 SMA as Intel was. The stop is placed below the 200 SMA. Execution logic is very similar to the wedge breakout, with the key difference being the emphasis on the 200 SMA reclaim as the trigger level rather than a nearer-term resistance.
Q: Why is the long-term downtrend break preferred over the wedge breakout?
The long-term downtrend break is favored because its breakout and consolidation are often slow and steady rather than a giant single breakout candle. That pace gives time to build a position and ride the move gradually. With a wedge breakout, the first day of the breakout is frequently all there is: the stock shoots up and the entry is missed. The slower profile of the long-term pattern makes it easier to execute without chasing.
Q: What indicators are used for swing trading on the daily chart?
Two indicators are used on the daily chart for swing trading: the 200 SMA and the 8 EMA. The 8 EMA tracks whether a stock has reclaimed short-term momentum, with entries requiring the candle to ride above it. The 200 SMA marks the long-term trend, serving as the level a downtrending stock must reclaim in the long-term downtrend break pattern, and as the location for the stop loss on that setup. Both are applied to the daily chart rather than intraday time frames.
Summary & Key Takeaways
-
Chart patterns are treated with skepticism for intraday day trading but have repeatedly worked on the daily chart for large cap stocks in swing trading. Because swing positions are held longer, the charts are more forgiving and a trade has more time to work out. The three fundamental patterns are breakout, breakdown, and consolidation.
-
Pattern one is the wedge breakout, also called the triangle breakout, rising wedge, or downtrend break. The stock must retest a downtrend for at least one to three weeks, then reclaim the 8 EMA and break above resistance. Examples given are AU, a gold stock breaking above the 3350s, and ERJ, an energy stock breaking to 52-week highs.
-
Pattern two is the long-term downtrend break, applied only to large caps above $800 million market cap because smaller stocks are dilutive. Intel had trended down since early 2024 and had a new semiconductor-experienced CEO as a catalyst; Corsair traded below the 200 SMA since late 2023 before reclaiming the 8 EMA and running from around $8.50 to $12.
Read in Other Languages (beta)
Share This Summary 📚
Summarize YouTube Videos and Get Video Transcripts with 1-Click
Try YouTube Summary with ChatGPT & Claude or YouTube Transcript Generator
Explore More Summaries from Humbled Trader 📚





Summarize YouTube Videos and Get Video Transcripts with 1-Click
Try YouTube Summary with ChatGPT & Claude or YouTube Transcript Generator