How to do Python data analytics with AB testing?
TL;DR
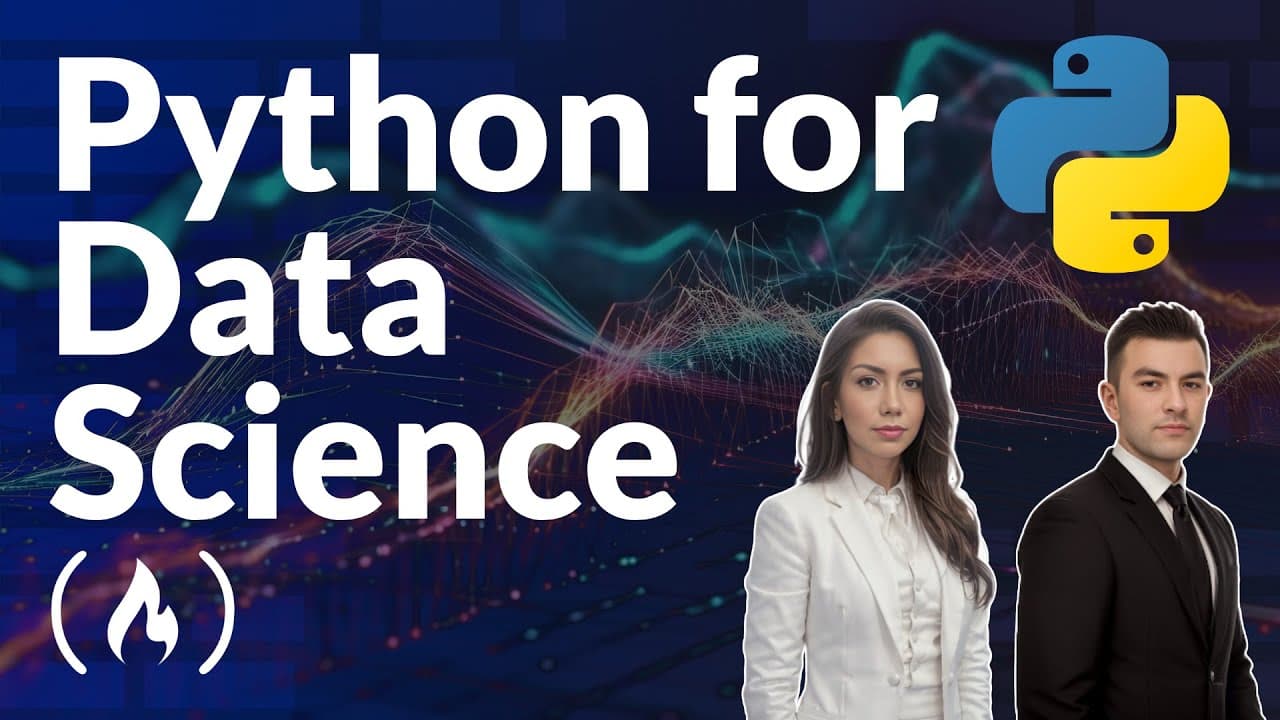
You gain hands on Python data analytics skills with data loading, wrangling, visualization, and descriptive statistics, plus AB testing theory and two end to end portfolio projects. The course covers practical applications in data analytics and business intelligence and provides real world examples like a landing page experiment and a Superstore analysis.
Transcript
this comprehensive python data science course covers the essentials through Theory demos and real world applications with two detailed projects this course is designed to provide practical experience that will prepare you for real world data science you'll gain Hands-On knowledge in data analytics AB testing and business intelligence if you aspirin... Read More
Key Insights
- Python data analytics is introduced through practical data loading and preprocessing with pandas, enabling real world data work.
- AB testing theory is emphasized as a core skill for any data driven decision with emphasis on hypothesis and experiment design.
- Data visualization in Python is presented as essential for communicating insights and supporting decisions.
- Descriptive statistics are used to summarize data and inform later analytical steps.
- Merging and joining datasets are taught to combine information from multiple sources for richer analysis.
- Two end to end projects provide hands on practice with AB testing and business intelligence scenarios.
- The course includes two GitHub projects to extend learning beyond the video content.
- The instructors have industry experience and aim to make data science accessible to a broad audience.
Install to Summarize YouTube Videos and Get Transcripts
Explore YouTube Video Summarizer or Get YouTube Transcript Extractor
Questions & Answers
Q: How to start with data analytics in Python using pandas?
To start with data analytics in Python, you load data using pandas read functions such as read_csv for CSV files, print the dataframe to inspect columns and rows, and then perform basic wrangling like filtering, sorting, and grouping. You will practice loading different file types and building a workflow that moves from raw data to a cleaned dataset ready for analysis.
Q: What is AB testing and why is it important in data science?
AB testing is a method to compare two or more variants of a product or feature to determine which performs better based on a primary metric. It is crucial in data science because it provides evidence driven decisions that guide product changes, user experience improvements, and algorithm updates, ensuring changes lead to measurable improvements.
Q: What are the key stages of an AB test workflow?
The AB test workflow includes defining the business problem, selecting a primary metric, designing the test with appropriate sample size, running the experiment, collecting data, and performing a data analysis to decide which variant wins. This process emphasizes statistical validity and practical significance for reliable decisions.
Q: What Python tools are used for data visualization in this course?
The course emphasizes data visualization in Python as a key skill, using libraries that enable plotting, quick exploration, and communicating insights. Visualization helps illustrate distributions, trends, and comparisons across groups, supporting data driven storytelling and supporting conclusions drawn from statistical analysis.
Q: What are two end to end projects taught in the course?
The two end to end projects are an AB testing focused online analytics project and a second project on Superstore data. The AB testing project guides you from test design to data analysis and decision making, while the Superstore project covers customer segmentation, revenue analysis, and loyalty insights to demonstrate applied analytics.
Q: What prerequisites are needed to follow the AB testing portion?
For the AB testing portion, you should have fundamentals in statistics, including probability and normal distribution. You need to understand how to sample data to infer insights about a population, and you should be prepared to design experiments and interpret results using data analytics techniques described in the course.
Q: What are the GitHub resources mentioned for further practice?
The course provides two GitHub repositories for extended practice: one for AB testing case studies and another for the Superstore case study. These projects include code and data to complement the video content, enabling learners to replicate experiments, run analyses, and showcase their work in portfolios.
Q: Who is the course aimed at and what outcomes can learners expect?
The course targets aspiring data analysts, data scientists, and anyone seeking practical Python data analytics skills, including AB testing and business intelligence. Learners can expect hands on experience, portfolio ready projects, and a foundation for real world analytics tasks like data wrangling, visualization, and experimentation.
Summary & Key Takeaways
-
The first summary point covers Python data analytics basics including loading data, cleaning, and preprocessing to prepare datasets for analysis in Python.
-
The second summary point highlights AB testing theory and how to design experiments, compute metrics, and draw data driven conclusions for online problems.
-
The third summary point describes the two end to end portfolio projects focusing on AB testing implementation and a Superstore case study to demonstrate practical data analytics skills.
Read in Other Languages (beta)
Share This Summary 📚
Summarize YouTube Videos and Get Video Transcripts with 1-Click
Try YouTube Summary with ChatGPT & Claude or YouTube Transcript Generator
Explore More Summaries from freeCodeCamp.org 📚


Summarize YouTube Videos and Get Video Transcripts with 1-Click
Try YouTube Summary with ChatGPT & Claude or YouTube Transcript Generator