How to Plot Geographical Data with Python's Basemap
TL;DR
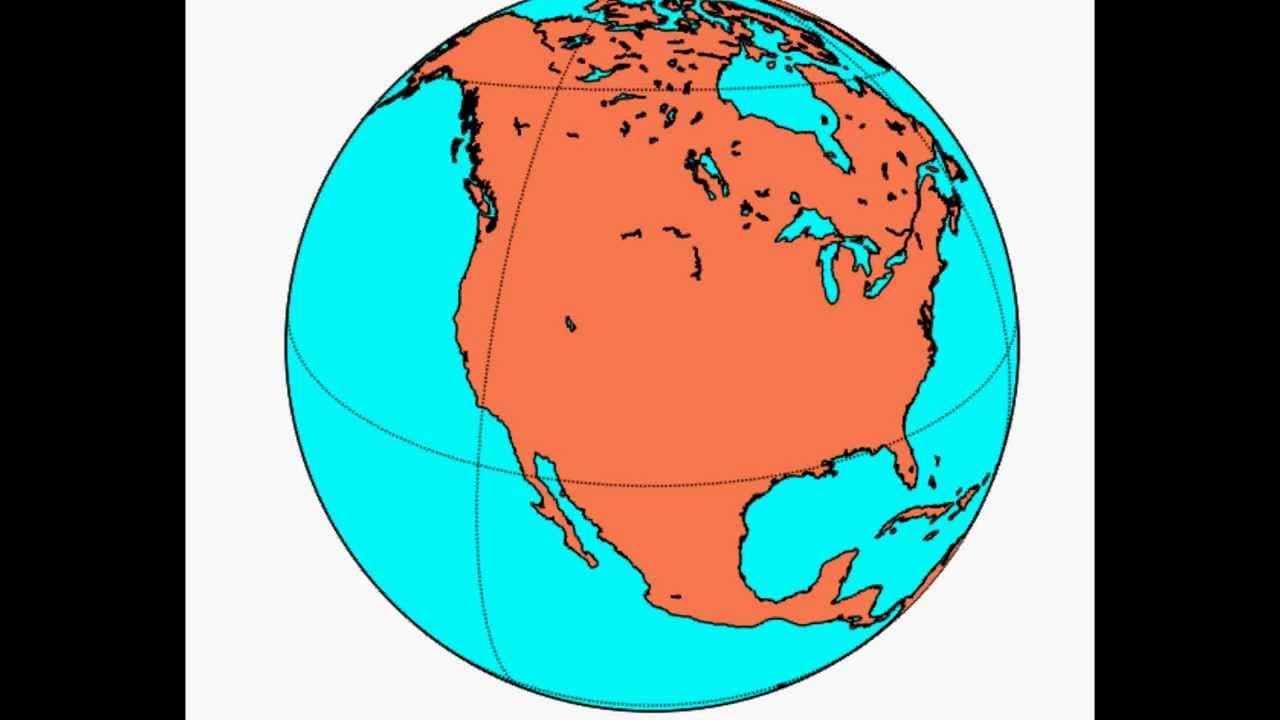
To plot geographical data using Python, start by installing the Basemap module alongside Matplotlib. Set up your map by specifying the projection and corners, then draw coastlines and fill continents to visualize your data on a map. This tutorial guides you through creating your first geo chart effectively.
Transcript
hello everybody and welcome to the geographical plotting within python tutorial or basically how to plot data onto a map using latitude and longitude to do this we're going to be using a module called base map which works alongside mat plot lives so a lot of your matplotlib skills will be directly transferable here I'm going to assume that anybody ... Read More
Key Insights
- 🍁 The base map module in Python allows for plotting geographical data on a map using latitude and longitude coordinates.
- 🍁 Different map projections can be selected depending on the desired visualization, such as Miller cylindrical or azimuthal equidistant.
- 💦 The installation of matplotlib and PIL is necessary to work with base map.
Install to Summarize YouTube Videos and Get Transcripts
Explore YouTube Video Summarizer or Get YouTube Transcript Extractor
Questions & Answers
Q: What is the purpose of the base map module in Python?
The base map module in Python allows users to plot geographical data on a map by using latitude and longitude coordinates.
Q: What other modules should be installed before working with base map?
To work with base map, users should have matplotlib and PIL (Python Imaging Library) installed.
Q: Can different projections be used in base map?
Yes, base map offers various projections to choose from depending on the desired visualization, such as Miller cylindrical projection or azimuthal equidistant projection.
Q: How can the boundaries of a projection be specified?
By specifying the coordinates of the lower left (LLC) and upper right (CRN) corners, users can define the boundaries of their map projection.
Summary & Key Takeaways
-
The tutorial covers the basics of plotting geographical data on a map using latitude and longitude.
-
It introduces the base map module and explains how it works alongside matplotlib.
-
The video demonstrates how to set up a base map, specify the projection and corners, draw coastlines and fill continents, add a title, and display the plot.
Read in Other Languages (beta)
Share This Summary 📚
Summarize YouTube Videos and Get Video Transcripts with 1-Click
Try YouTube Summary with ChatGPT & Claude or YouTube Transcript Generator
Explore More Summaries from sentdex 📚




Summarize YouTube Videos and Get Video Transcripts with 1-Click
Try YouTube Summary with ChatGPT & Claude or YouTube Transcript Generator