Why Does the S&P 500 Move With Nvidia Stock?

TL;DR
The S&P 500 moves with Nvidia because Nvidia accounted for 32% of the index’s total return in 2024, giving one stock exceptional influence over the broader index. The presenter does not view that concentration as an immediate crash signal and expects lagging stocks could join the rally, but considers yield-curve normalization driven by sharply rising 10-year yields a major warning. Read on to understand the potential rally and its key risk indicators.
Transcript
what is going on Traders if I showed you this chart right here would you say that this was Nvidia or the S&P 500 if you said either of them you'd be right because both charts look identical right now as Nvidia goes so does the S&P 500 so is this concentration bad well lucky for you I've done a deep dive and here's why I think the stock market can g... Read More
Key Insights
- Nvidia accounted for 32% of the S&P 500's total return in 2024, according to the figures presented. This unusually large contribution explains why Nvidia and the broader index displayed nearly identical chart patterns during the period discussed.
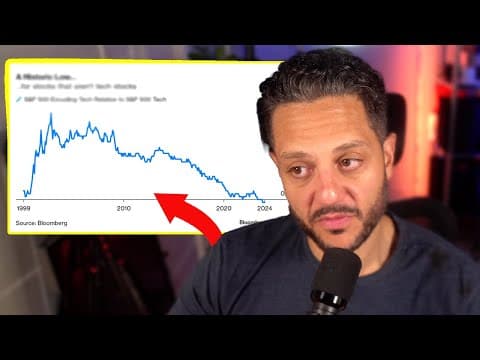
- Market concentration is not presented as an automatic crash signal. From 2014 through 2023, the top 10 US stocks averaged 19% of market capitalization while producing 47% of overall US earnings, and their earnings share reached 69% in the prior year.
- Rising concentration can support a broader market advance, according to the historical interpretation presented. The greater danger begins when concentration declines, with the dot-com aftermath and the 2008 crash cited as examples of trouble occurring during falling concentration.
- A bottom-up effect can lift market laggards during highly concentrated periods. The presenter says Russell 2000 companies, other S&P 500 constituents, and some Dow stocks may rise toward the valuations or performance established by the dominant top 10 companies.
- Yield-curve uninversion has historically preceded the Federal Reserve's first rate cut in the examples examined. The presenter cites cuts in January 1991, January 2001, and September 2007 after the curve had moved from inversion toward a more normal structure.
- Falling two-year yields could normalize the curve when markets become confident that the Federal Reserve will cut rates. Because the federal funds rate is an overnight, short-term rate, expected policy cuts influence the short end of the yield curve more directly.
- Sharply rising 10-year yields would be the more concerning cause of yield-curve normalization. The presenter connects that possibility to stress in commercial or residential real estate and believes a disproportionate increase in long-term yields could end the market rally.
- The presenter's strategy is to remain a selective stock buyer while monitoring the yield curve and approaching rate cuts. Apple was purchased around 165 based on technical support and expected AI announcements, while cash-secured puts were sold on Tesla during the prior week.
Install to Summarize YouTube Videos and Get Transcripts
Explore YouTube Video Summarizer or Get YouTube Transcript Extractor
Questions & Answers
Q: Why does the S&P 500 move with Nvidia stock?
Nvidia accounted for 32% of the S&P 500’s total return in 2024, according to the figures presented. Because one stock supplied nearly one-third of the index’s return, Nvidia’s movements strongly shaped the S&P 500’s performance and made their charts look nearly identical.
Q: Does high stock market concentration mean a crash is imminent?
No, the presenter does not treat high concentration as an immediate crash signal. From 2014 through 2023, the top 10 US stocks averaged 19% of market capitalization while producing 47% of overall US earnings, and their earnings share reached 69% in the prior year.
Q: How could market concentration help lagging stocks rally?
The presenter describes a bottom-up effect in which lagging stocks rise toward the level established by the dominant top 10 companies. Potential beneficiaries include Russell 2000 companies, other S&P 500 constituents, and some Dow stocks.
Q: When does stock market concentration become dangerous?
The presenter associates greater danger with falling concentration rather than rising concentration. The decline after the dot-com boom and the period containing the 2008 crash are cited as examples of trouble occurring while concentration was falling.
Q: What can cause an inverted yield curve to normalize?
The two-year yield can fall much faster than the 10-year yield, or the 10-year yield can rise much faster than the two-year yield. Either path can restore the usual structure in which longer-term rates pay more than shorter-term rates, but the presenter views the two outcomes differently.
Q: Why could expected Federal Reserve cuts lower the two-year yield?
The federal funds rate is an overnight, short-term rate, so anticipated Federal Reserve cuts affect the short end of the yield curve more directly. When markets become confident that cuts are approaching, the two-year yield could fall before the policy change occurs.
Q: Why would sharply rising 10-year yields be a warning for stocks?
The presenter considers normalization driven by sharply rising 10-year yields more dangerous than normalization caused by falling short-term yields. He connects such a rise to possible stress in commercial or residential real estate and believes it could end the market rally.
Q: What investment strategy does the presenter describe?
The presenter remains a selective stock buyer while watching the yield curve and approaching Federal Reserve cuts. He purchased Apple around 165, sold cash-secured puts on Tesla during the prior week, and plans to consider exiting when a Federal Reserve cut follows yield-curve normalization.
Summary & Key Takeaways
-
Nvidia's exceptional influence made its chart resemble the S&P 500 because the company contributed 32% of the index's 2024 total return. The presenter argues that this concentration does not automatically signal an immediate crash, since leading companies have historically represented a disproportionately large share of US corporate earnings.
-
The presenter expects a possible bottom-up rally in which Russell 2000 companies, other S&P 500 members, and some Dow stocks rise toward the performance of the highly concentrated leaders. Pullbacks may interrupt that advance, but increasing concentration and clearer expectations of Federal Reserve cuts could initially remain supportive for stocks.
-
The yield curve is presented as the main warning indicator. Previous examples cited from 1991, 2001, and 2007 showed an uninversion before the first Federal Reserve cut. The presenter plans to watch whether falling two-year yields or sharply rising 10-year yields drive normalization, treating the second scenario as substantially more dangerous.
Read in Other Languages (beta)
Share This Summary 📚
Summarize YouTube Videos and Get Video Transcripts with 1-Click
Try YouTube Summary with ChatGPT & Claude or YouTube Transcript Generator
Explore More Summaries from The Traveling Trader 📚



Summarize YouTube Videos and Get Video Transcripts with 1-Click
Try YouTube Summary with ChatGPT & Claude or YouTube Transcript Generator