How to Trade FOMC Two-Stage Delivery
TL;DR
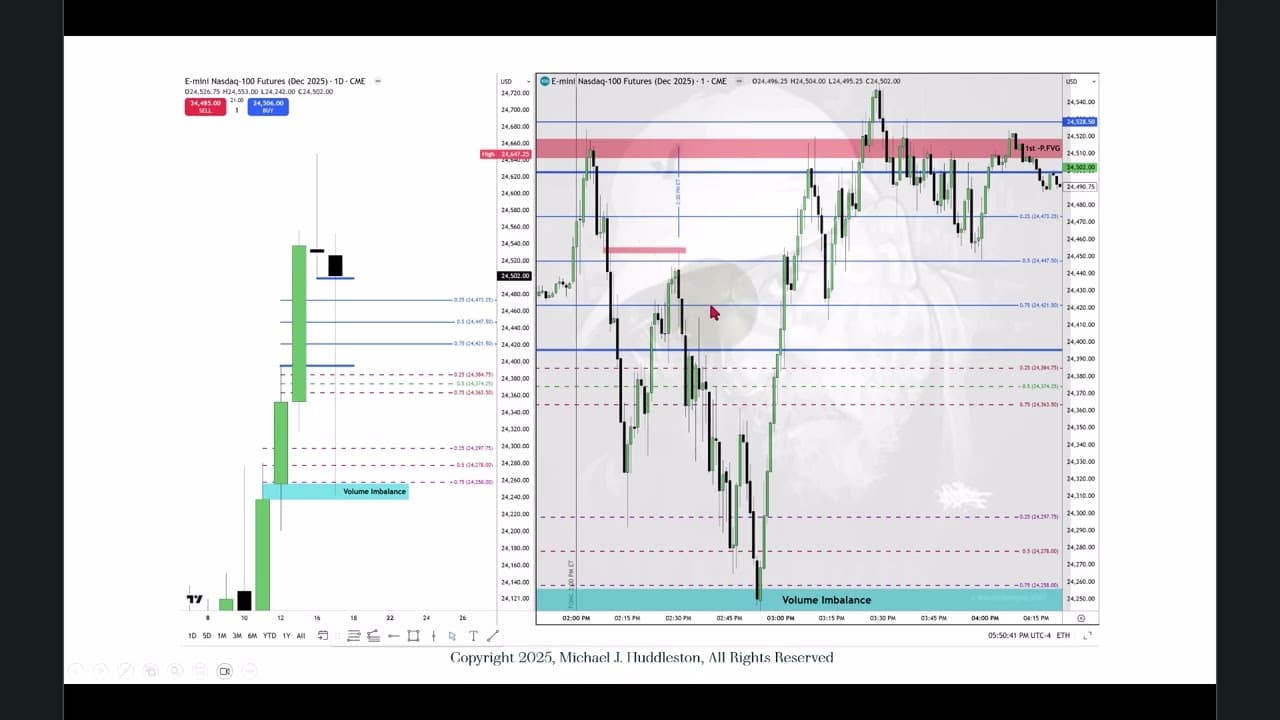
Trade FOMC two-stage delivery by identifying the initial liquidity run, confirming a market-structure shift, and then watching for a retracement into premium and a fair value gap before the secondary move. The NASDAQ example uses daily and one-minute charts, the 2022 model, and an optimal trade entry near a three-quarter pullback. Read on for the specific chart levels and sequence used to analyze the setup.
Transcript
Hello folks, welcome back. Today is September 17th, 2025. Okay, and tonight's lecture is going to be on trading FOMC two-stage delivery. All right, so we're looking at the NASDAQ. uh we rolled over to December contract. In case you haven't noticed, the the volume open interest has increased to the degree that December is now higher and more active.... Read More
Key Insights
- FOMC announcements often lead to two-stage market deliveries, with initial reactions followed by secondary movements.
- Understanding liquidity pools, such as buy-side and sell-side, is crucial for anticipating market moves.
- Fair value gaps and volume imbalances are key indicators for identifying potential trade entries and exits.
- Intraday charts provide detailed insights into market structure shifts, essential for short-term trading decisions.
- Optimal trade entries often occur at 3/4 pullbacks within impulsive price legs, aligning with fair value gaps.
- Market sensitivity to premium and discount levels can guide traders in setting targets and stop-losses.
- Daily charts should be used to identify broader market trends, while intraday charts focus on precise entry points.
- Price action around specific time zones, such as 2 PM during FOMC days, can offer additional trading opportunities.
Install to Summarize YouTube Videos and Get Transcripts
Explore YouTube Video Summarizer or Get YouTube Transcript Extractor
Questions & Answers
Q: How do you trade an FOMC two-stage delivery?
First, identify the initial run on liquidity and the subsequent market-structure shift. Then use the 2022 model: grade the impulsive price leg, wait for price to retrace above the 50% premium level, and look for convergence with a fair value gap or a three-quarter pullback before the secondary move.
Q: What is the FOMC two-stage delivery shown in the NASDAQ example?
The example begins with a 9:30 a.m. run above relatively equal highs into buy-side liquidity, followed by a bearish break and a shift in market structure. Price then rallies into the first presented fair value gap before selling through the remaining sell-side liquidity pool.
Q: Which charts are used to analyze the FOMC setup?
The analysis uses the daily chart and a one-minute candlestick chart for the December NASDAQ futures contract. The daily chart supplies the broader reference levels, while the one-minute chart reveals the liquidity run, market-structure shift, and lower-time-frame entry setup.
Q: How is the 2022 model applied after a bearish market-structure shift?
Run the Fibonacci measurement from the impulsive high to the low and wait for price to trade into premium, meaning above 50%. Ideally, that retracement converges with a small inefficiency or fair value gap and the optimal trade entry around a three-quarter pullback.
Q: Why are relatively equal highs and lows marked on the chart?
Relatively equal highs identify a buy-side liquidity pool, while relatively equal lows identify sell-side liquidity. In the example, price runs the buy-side liquidity at the 9:30 opening, breaks lower, and later targets sell-side liquidity.
Q: What does unfinished business mean in this setup?
Unfinished business occurs when price rallies while sell stops beneath relative equal lows remain intact. The speaker describes that rally as false hope for bulls because price can rise into the first presented fair value gap and then sell through the remaining sell-side liquidity pool.
Q: How are daily fair value gap levels graded?
The daily buy-side imbalance and sell-side inefficiency is divided into its low, lower quadrant, consequent-encroachment midpoint, upper quadrant, and high. These graded levels are then carried onto the one-minute chart so the lower-time-frame movement can be analyzed relative to the daily range.
Q: How should traders approach markets near all-time highs?
Focus on specific price points, volume imbalances, fair value gaps, and candle opens and closes rather than trying to pick the top. The speaker says shorts can be considered intraday by a seasoned analyst, but larger price runs are more likely to remain aligned with movement higher.
Summary & Key Takeaways
-
The FOMC announcement impacts market structure, leading to two-stage deliveries. Traders should focus on liquidity pools and fair value gaps to identify opportunities. Key strategies include using daily and intraday charts to spot premium and discount sensitivities, ensuring trades align with broader market trends while capitalizing on short-term movements.
-
Trading the FOMC involves recognizing shifts in market structure and liquidity. Utilizing fair value gaps and volume imbalances helps traders pinpoint optimal entries and exits. By analyzing both daily and intraday charts, traders can align their strategies with market trends, focusing on premium and discount levels for effective trade management.
-
Successful trading during FOMC announcements requires understanding market dynamics and liquidity pools. Identifying fair value gaps and using optimal trade entries are essential strategies. Traders should leverage daily and intraday charts to assess market sensitivities, ensuring trades are executed in line with both long-term trends and short-term price actions.
Read in Other Languages (beta)
Share This Summary 📚
Summarize YouTube Videos and Get Video Transcripts with 1-Click
Try YouTube Summary with ChatGPT & Claude or YouTube Transcript Generator
Explore More Summaries from The Inner Circle Trader 📚

Summarize YouTube Videos and Get Video Transcripts with 1-Click
Try YouTube Summary with ChatGPT & Claude or YouTube Transcript Generator