How to Add an Indicator Menu in Tkinter with Python 3.4, Part 15
TL;DR
Add separate Tkinter menus for top, middle, and bottom graph indicators, then connect each menu command to the corresponding back-end function. The tutorial assigns RSI and MACD to menus outside the main graph, while SMA and EMA appear on the main graph. Read on for the exact menu structure, command wiring, defaults, and planned code consolidation.
Transcript
everybody what is going on welcome to the 15th tkinter quote-unquote mega series tutorial with Python 3 we're going to be doing is adding a few more options to our to intern window along with the required back-end functions for it so what we're going to go ahead and do is scroll on down to our c BD c class here write the app class coming down here ... Read More
Key Insights
- Placement determines menu design: The interface is organized around where each indicator will be drawn, not merely around indicator names. Top means above the graph, middle means on the graph, and bottom means below it. This positioning model guides both the visible menu categories and the separate functions that will eventually process each selection.
- None is an explicit choice: Every indicator section begins with a none command so the user can decline to display an indicator in that position. The command still invokes the appropriate callback and passes none as its argument. This keeps the selection path consistent even when the requested outcome is an empty indicator region.
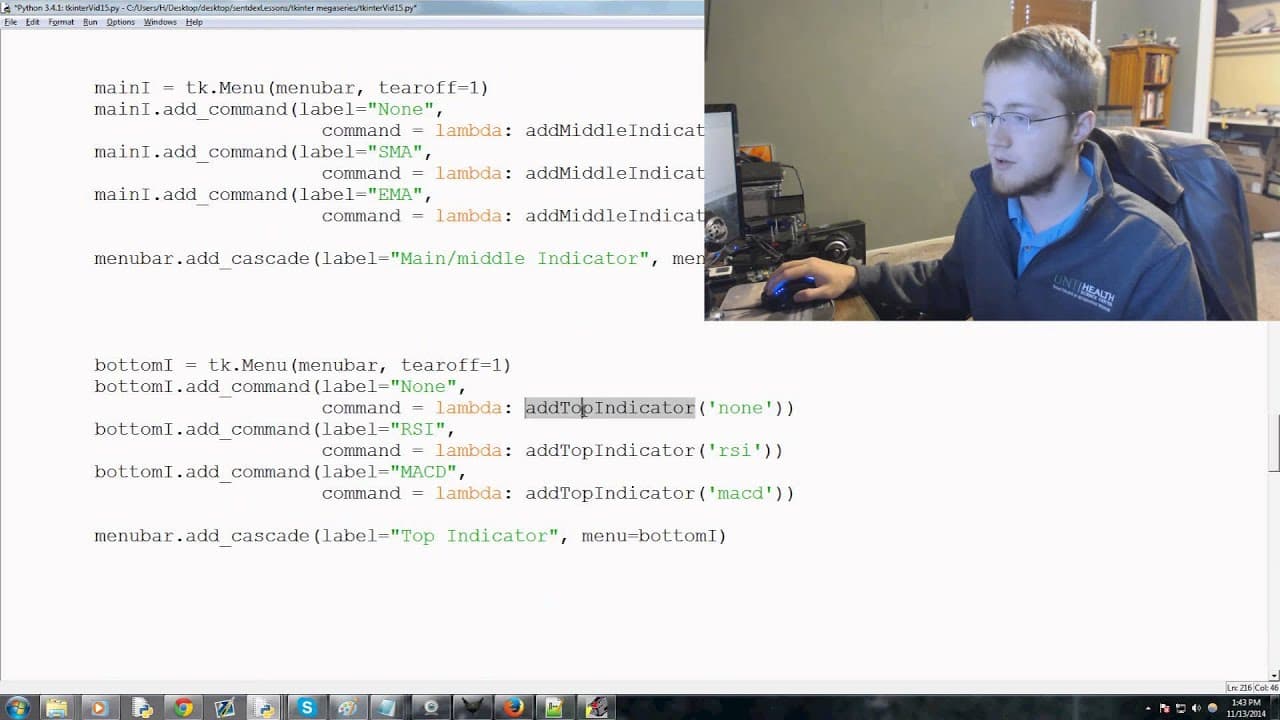
- Callbacks carry selected values: Each menu command uses a lambda to send the chosen indicator value into a back-end function. The top menu passes none, RSI, or MACD to add top indicator. The same pattern is copied for the middle and bottom menus, with their callback names changed to match the selected graph region.
- Menu objects need consistent references: Copying the top menu accelerates construction, but every internal reference must be updated. The tutorial changes the menu variable, the callback function, the cascade label, and the cascade's menu argument. Missing even one replacement could leave a new menu pointing at the top section's object or behavior.
- Scale compatibility shapes choices: RSI and MACD are excluded from the main graph menu because their scales differ from the main graph and would make the display look strange. SMA and EMA are appropriate there because they are moving averages intended to appear on the primary graph. Indicator placement is therefore constrained by visual compatibility.
- Top choices remain flexible: The top menu offers both RSI and MACD in addition to none. The tutorial describes RSI as an example of an indicator that can appear above the graph. MACD can also be selected there, showing that the top region is not restricted to a single technical indicator.
- Bottom mirrors top options: The bottom indicator section keeps RSI and MACD as valid choices, along with none. It changes the menu identity, label, and callback to bottom-specific versions while preserving the option set. This creates equivalent choices above and below the graph without treating those regions as the same application state.
- Separate cascades favor visibility: Top, middle, and bottom indicators are placed in their own menu-bar sections because the interface has enough available space. The tutorial acknowledges that they could instead be grouped beneath one indicator tab with nested submenus. The chosen structure favors immediate access while leaving hierarchical organization as an alternative.
- Three functions come next: Creating visible menu entries is only the front-end portion of the change. The selections require add-top, add-middle, and add-bottom functions to supply the corresponding behavior. The tutorial explicitly transitions from menu construction to these three back-end functions after all cascades and commands have been defined.
- One function could replace three: A generalized add-indicator function could receive two parameters, one identifying top, middle, or bottom and another identifying the requested indicator. The tutorial recognizes that the three functions can be condensed and says this will become necessary later. For now, separate functions make the positional behavior explicit.
- Defaults begin without indicators: The top, middle, and bottom indicator variables are initialized to none near the script's constants and other default values. This reflects the stated general practice of starting without a default indicator. The menus then allow users to add only the graph elements they actually choose.
- Moving averages support multiples: Empty lists are introduced for the moving-average selections rather than using only one fixed value. The reason given is that many users want crossover configurations and may add several moving averages. The planned state structure therefore differs from the single top, middle, and bottom defaults by accommodating repeated additions.
Install to Summarize YouTube Videos and Get Transcripts
Explore YouTube Video Summarizer or Get YouTube Transcript Extractor
Questions & Answers
Q: How do you add an indicator menu in Tkinter with Python 3.4?
Create a Tkinter Menu for each indicator position and attach it to the existing menu bar with add_cascade. Add commands for the allowed choices, then use lambdas to pass each selected value to a position-specific function. The tutorial creates top, main or middle, and bottom menus. This structure connects visible choices to the back-end functions needed to handle them.
Q: What indicator options belong in the top, middle, and bottom menus?
The top menu contains none, RSI, and MACD. The middle menu contains none, SMA, and EMA because moving averages belong on the main graph. The bottom menu again contains none, RSI, and MACD. These groupings follow where the indicators appear and whether their scale fits the main graph.
Q: Why are RSI and MACD excluded from the main graph menu?
RSI and MACD use a different scale from the main graph. Placing them directly on that graph would therefore look strange. The tutorial assigns SMA and EMA to the middle menu instead. RSI and MACD remain available in the top and bottom regions, where they can appear outside the primary graph.
Q: How does a Tkinter menu command pass the selected indicator?
Each command uses a lambda that calls the function for the relevant position. The selected indicator is supplied as the function parameter, such as none, RSI, or MACD for the top menu. Middle commands use the middle callback and pass SMA or EMA when selected. This lets one menu section route several choices through its matching handler.
Q: How can users choose to display no indicator?
Each positional menu includes a command labeled none. Selecting it calls that position's add-indicator function with none as the parameter. The top, middle, and bottom state variables also begin with none as their default. This gives the application a clean initial state and an explicit no-indicator selection.
Q: Can the indicator menus be combined under one menu?
Yes, the tutorial says all indicator controls could be placed beneath one tab called indicator. That tab could contain nested top, middle, and bottom entries, each opening another level of choices. The example is compared with a recent-files submenu that opens into additional items. The implementation shown keeps three separate sections because the menu bar has enough space.
Q: Why does the tutorial use three indicator functions?
The menu design requires handlers for adding top, middle, and bottom indicators. The tutorial initially keeps these as separate functions so each graph position has a distinct callback. It also notes that they could be condensed into one add-indicator function. Such a function would receive both the position and the selected indicator as parameters.
Q: Why are moving averages stored in empty lists?
The moving-average state is initialized with empty lists because users may want more than one moving average. The tutorial specifically connects this need to crossover configurations. A list can hold repeated SMA or EMA additions instead of limiting the graph to one fixed selection. This differs from the positional indicator defaults, which initially equal none.
Summary & Key Takeaways
-
Defining three indicator positions: Part 15 expands the Tkinter application with indicator options and the back-end functions they require. The graph interface separates indicators by placement. A top indicator appears above the graph, a middle indicator appears directly on the main graph, and a bottom indicator appears below it. Relative strength index and MACD can occupy an outside section, while moving averages belong on the main graph because they share its visual context.
-
Building the top menu: The top indicator is created as a Tkinter menu attached to the existing menu bar, with tear-off set to 1. Three commands are added: none, RSI, and MACD. Each command uses a lambda to call the top-indicator function with the selected value. Choosing none passes none, while the other commands pass lowercase RSI or MACD values. The completed menu is exposed through a menu-bar cascade labeled top indicator.
-
Duplicating menus by position: Rather than writing every remaining menu from scratch, the top-indicator block is copied twice to create main and bottom sections. The copied identifiers, cascade labels, menu references, and callback names must all be changed for their new roles. The tutorial keeps top, middle, and bottom as separate menu-bar categories because space is available, although it also describes nesting all three beneath one general indicator menu.
-
Matching indicators to scales: The middle, or main, indicator menu does not offer RSI or MACD because those indicators use a different scale and would look strange on the main graph. Its selectable indicators are SMA, meaning simple moving average, and EMA, meaning exponential moving average. The callbacks are also corrected from add top indicator to add middle indicator. The bottom menu instead retains none, RSI, and MACD and connects its commands to the bottom-indicator function.
-
Preparing application state: After creating the menu items, the tutorial identifies three required functions: add top, add middle, and add bottom. A single generalized add-indicator function could accept both a position and an indicator, but that consolidation is postponed. Near the script constants and default values, top, middle, and bottom indicator state is initialized to none. Separate empty lists are also prepared for moving averages because users may want multiple averages for crossover analysis.
Read in Other Languages (beta)
Share This Summary 📚
Summarize YouTube Videos and Get Video Transcripts with 1-Click
Try YouTube Summary with ChatGPT & Claude or YouTube Transcript Generator
Explore More Summaries from sentdex 📚


Summarize YouTube Videos and Get Video Transcripts with 1-Click
Try YouTube Summary with ChatGPT & Claude or YouTube Transcript Generator