How Does Spectral Analysis Reveal Signal Structures?
TL;DR
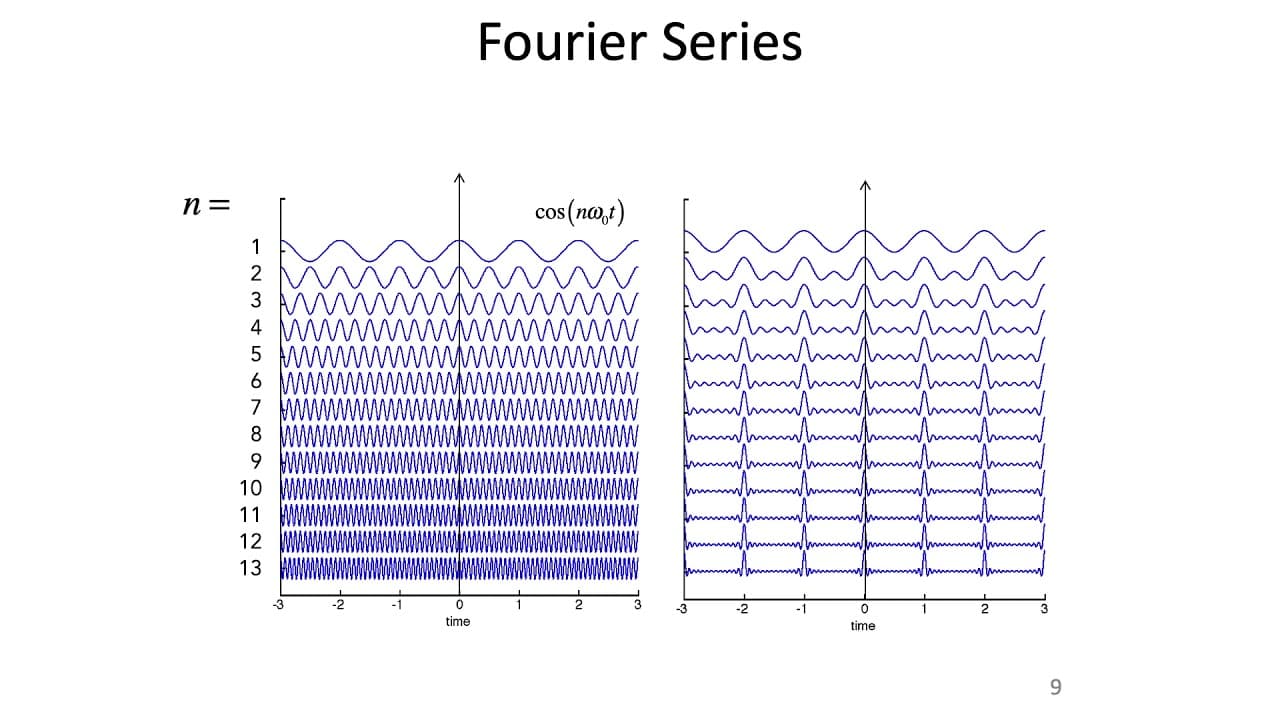
Spectral analysis uses Fourier transforms to decompose signals into their frequency components, enhancing our understanding of their temporal behavior. Power spectra illustrate how power is distributed across various frequencies, allowing for effective analysis of a range of signals, including speech and periodic functions.
Transcript
MICHALE FEE: So who remembers what that's called? A spectrograph. Good. And it's a spectrogram of me. Good morning, class. OK. So it's a spectrogram of speech. And so we are going to continue today on the topic of understanding-- developing methods for understanding how to characterize and understand temporally structured signals. So that is the mi... Read More
Key Insights
- 🍳 Fourier transforms are mathematical operations used to break down signals into their frequency components.
- ✊ Power spectra provide information about the distribution of power across different frequencies in a signal.
Install to Summarize YouTube Videos and Get Transcripts
Explore YouTube Video Summarizer or Get YouTube Transcript Extractor
Questions & Answers
Q: What is a Fourier transform?
A Fourier transform is a mathematical operation that decomposes a signal into its frequency components, allowing for a better understanding of its temporal structure.
Q: How can Fourier transforms be applied to understand signals?
Fourier transforms can be used to analyze different types of signals, such as cosine and sine functions, delta functions, and square waves, by representing them as a sum of frequency components.
Q: What is the power spectrum?
The power spectrum represents the distribution of power across different frequencies in a signal, reflecting the strength or amplitude of each frequency component.
Q: Why are power spectra often represented in decibels?
Power spectra are often represented in decibels because it allows for a more logarithmic scale that better represents the wide range of power values across frequencies.
Summary & Key Takeaways
-
Fourier transforms decompose signals into their frequency components, allowing for a better understanding of their temporal structure.
-
The power spectrum is a representation of the power distribution across different frequencies in a signal.
-
Power spectra can be used to analyze different types of signals, such as cosine and sine functions, delta functions, and square waves.
Read in Other Languages (beta)
Share This Summary 📚
Summarize YouTube Videos and Get Video Transcripts with 1-Click
Try YouTube Summary with ChatGPT & Claude or YouTube Transcript Generator
Explore More Summaries from MIT OpenCourseWare 📚
Summarize YouTube Videos and Get Video Transcripts with 1-Click
Try YouTube Summary with ChatGPT & Claude or YouTube Transcript Generator