Python Matplotlib Live Updating Graphs - part 2

TL;DR
This video explains how to create live updating charts using Matplotlib in Python, demonstrating how to import necessary libraries, define the figure and axes, pull data from a file, and plot the data.
Transcript
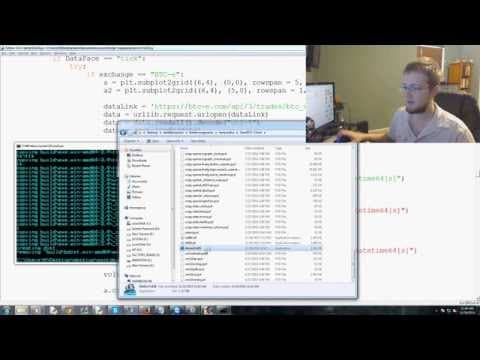
what is going on guys welcome to the second part of the live updating charts within matplot lib I know you're already just itching to get these charts out so sorry I made you guys look at documentation pretty much nobody likes it but you can find all kinds of gems in there so uh with that let's go ahead and get started we're going to need to import... Read More
Key Insights
- 🫒 Matplotlib and Matplotlib Animation libraries are essential for creating live updating charts.
- 👻 Defining the figure and axes provides customization options and allows for multiple plots.
- 🫠 Reading data from a file and splitting it into arrays enables the plotting of dynamic data.
- 📂 The "open" function is used to read the file, and the "split" function is used to separate the data.
- 🧘 The chart can be updated dynamically by editing the data file and saving it.
- 🫥 Clearing the plot helps prevent the accumulation of lines when updating the chart.
- 🫒 Live updating charts in Matplotlib provide real-time data visualization capabilities.
Install to Summarize YouTube Videos and Get Transcripts
Explore YouTube Video Summarizer or Get YouTube Transcript Extractor
Questions & Answers
Q: How do you import the necessary libraries for creating live updating charts in Matplotlib?
To import the libraries, you need to use the following commands: "import matplotlib.pyplot as plt", "import matplotlib.animation as animation", and "import time".
Q: What is the purpose of defining the figure and axes?
Defining the figure and axes allows you to customize the chart layout and add multiple plots if needed. It also provides a reference to the chart that will be updated.
Q: How do you read data from a file for the live updating chart?
You can use the "open" function in Python to read the file, specify the file name, and then use the "read" method to extract the data. The data can be split into arrays using the "split" function.
Q: How can the chart be updated dynamically by editing the data file?
By updating the data file with new values and saving it, the chart will automatically update when the program is running. This allows for real-time data visualization.
Summary & Key Takeaways
-
The video demonstrates how to import the required libraries, including Matplotlib and Matplotlib Animation, to create live updating charts.
-
The process involves defining the figure and axes, reading data from a file, and plotting the data on the chart.
-
The video also explains how to clear the plot and shows an example of how to update the chart by editing the data file.
Read in Other Languages (beta)
Share This Summary 📚
Summarize YouTube Videos and Get Video Transcripts with 1-Click
Try YouTube Summary with ChatGPT & Claude or YouTube Transcript Generator
Explore More Summaries from sentdex 📚


Summarize YouTube Videos and Get Video Transcripts with 1-Click
Try YouTube Summary with ChatGPT & Claude or YouTube Transcript Generator