How Does Producer Surplus Relate to the Supply Curve? | Consumer and Producer Surplus | Microeconomics | Khan Academy
TL;DR
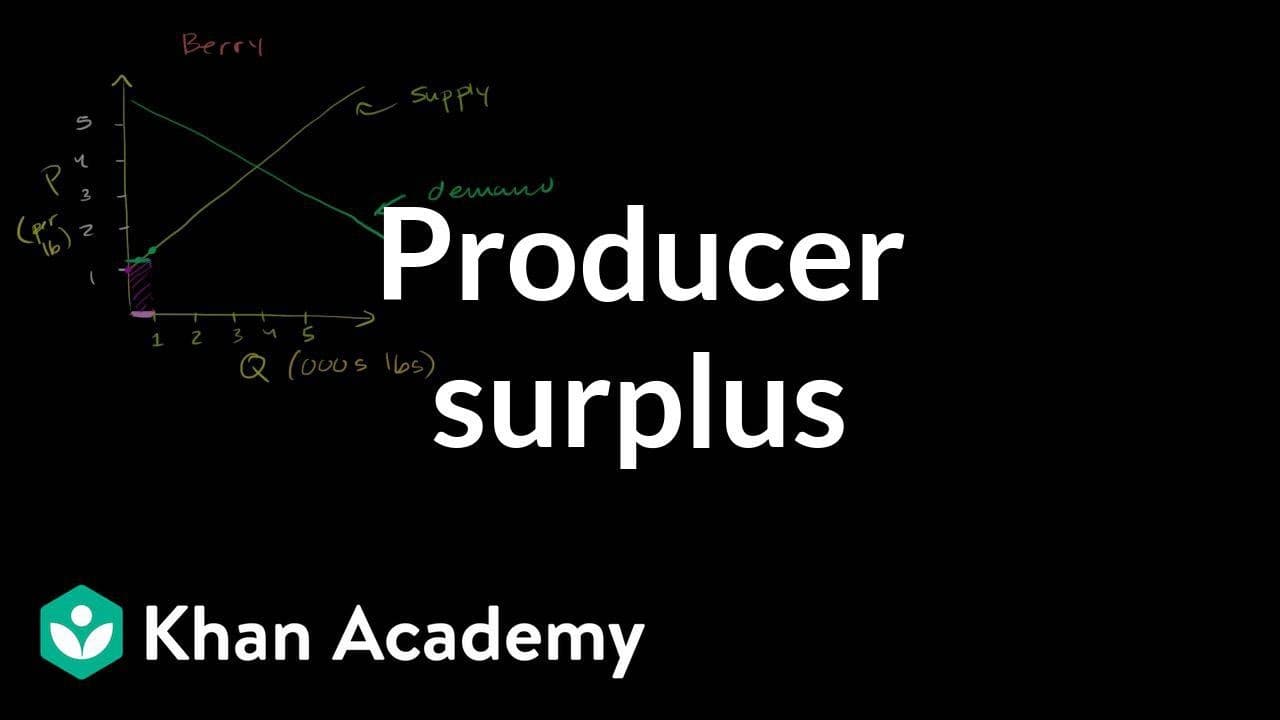
Producer surplus is the value producers receive above their opportunity cost when the market price exceeds the minimum price represented by the supply curve. In the berry-farm example, equilibrium occurs at $4 per pound and 4 thousand pounds, while earlier units have opportunity costs below $4. Read on to see why supply reflects rising opportunity costs and how the surplus area is calculated.
Transcript
We have now talked a lot about the demand curve and the consumer surplus; now let's look at the other side. Let's think about the supply curve and you could imagine that there might be something called the producer surplus. So let's say that this is price axis, this is the quantity axis and let's say that we are running some type of a berry farm an... Read More
Key Insights
- 🛀 The supply curve shows the quantity of a product producers are willing to supply at different prices.
- 🟰 Producers require a minimum price equal to their opportunity cost to produce a certain quantity.
- 🇨🇷 As the quantity supplied increases, the opportunity cost for producers also increases.
- 📞 Producer surplus represents the excess value that producers receive above their opportunity cost.
- 💁 It is calculated by finding the area of the triangle formed by the price, quantity, and supply curve.
- 🇨🇷 Producers can only produce a certain quantity if they can earn at least their opportunity cost.
- 🥺 Paying producers less than their opportunity cost would lead them to pursue other profitable opportunities.
Install to Summarize YouTube Videos and Get Transcripts
Explore YouTube Video Summarizer or Get YouTube Transcript Extractor
Questions & Answers
Q: What is producer surplus, and how is it related to the supply curve?
Producer surplus is the excess value producers receive above their opportunity cost. Because the supply curve represents producers’ opportunity costs, surplus arises for units whose opportunity cost is below the market price.
Q: Why can the supply curve be viewed as an opportunity cost curve?
For any desired quantity, the supply curve shows the minimum price producers must receive to supply that quantity. That minimum reflects what they give up by using their land, labor, and other resources for production instead of another opportunity.
Q: Why must producers receive at least their opportunity cost?
Producers could use the same resources for another activity that provides equivalent value. In the example, berry farmers might create an apple orchard, allow grazing, or rent out their land if berry production pays less.
Q: Why does opportunity cost rise as berry production increases?
Producers use their most suitable resources for the first units, including efficient labor, productive land, and locations near transportation networks. Additional production requires less suitable land or labor, so the opportunity cost of each additional thousand pounds rises.
Q: How can the supply curve be read using a target quantity?
Start with the quantity producers are expected to supply, then locate the corresponding price on the supply curve. For example, the lesson asks what price is required to induce production of 1 thousand, 2 thousand, or 3 thousand pounds of berries.
Q: What happens at a market price of $4 per pound and a quantity of 4 thousand pounds?
At that point, quantity supplied equals quantity demanded. The opportunity cost of the 4 thousandth pound is $4, so its producer is right on the fence, while the preceding 3,999 pounds have opportunity costs below the market price.
Q: How is producer surplus calculated on a supply-and-demand graph?
Producer surplus is represented by the area between the market price and the supply curve up to the quantity supplied. When this region is a triangle, its area is calculated as one-half times the base times the height.
Q: What resources make the first units of berry production less costly?
The first units use resources best suited to growing berries. The transcript identifies experienced labor, productive land, and proximity to transportation networks as factors that make production and shipping cheaper.
Summary & Key Takeaways
-
The supply curve represents the quantity of a product that producers are willing to supply at different prices.
-
Producers require a minimum price equal to their opportunity cost to produce a certain quantity of the product.
-
As the quantity supplied increases, the opportunity cost for producers also increases.
Read in Other Languages (beta)
Share This Summary 📚
Summarize YouTube Videos and Get Video Transcripts with 1-Click
Try YouTube Summary with ChatGPT & Claude or YouTube Transcript Generator
Explore More Summaries from Khan Academy 📚


Summarize YouTube Videos and Get Video Transcripts with 1-Click
Try YouTube Summary with ChatGPT & Claude or YouTube Transcript Generator