How much sits in first place: three public security datasets and what people ask Glasp for

Nov 10, 2026
6 min read
2 views
In three datasets we studied this month, one source or group holds between a tenth and three fifths of the whole. In Glasp's own demand, the most-requested one percent of videos together hold about six percent. Four cases, different units, no law.
Glasp Research. Keisuke Watanabe, Glasp Inc.
This month we wrote short studies of three public datasets. We also have an analysis of Glasp's event logs that we have not published separately, on which videos people ask Glasp about. Here we ask one question of all four: how much of the total belongs to whoever is in first place?
Sort the categories by count and report the share held by first place, first place divided by second place, and the share held by the top five.
The four cases were not chosen
These are the datasets we happened to have. No rule selected them. The units also differ: sources of vulnerability records, organisations that assign CVE ids, ransomware group names, and videos. So this describes four cases and does not compare like with like.
Vulnerability records by source
In one download of the OSV bulk file, dated 8 November 2026, we analysed 2,302,246 records published in 2019 or later. A record's source is its id prefix. That study counted everything twice, with and without the records tied to two batch days (the day with the most withdrawals, and the publication day with the most later-withdrawn records); these are the counts with those batch days kept.
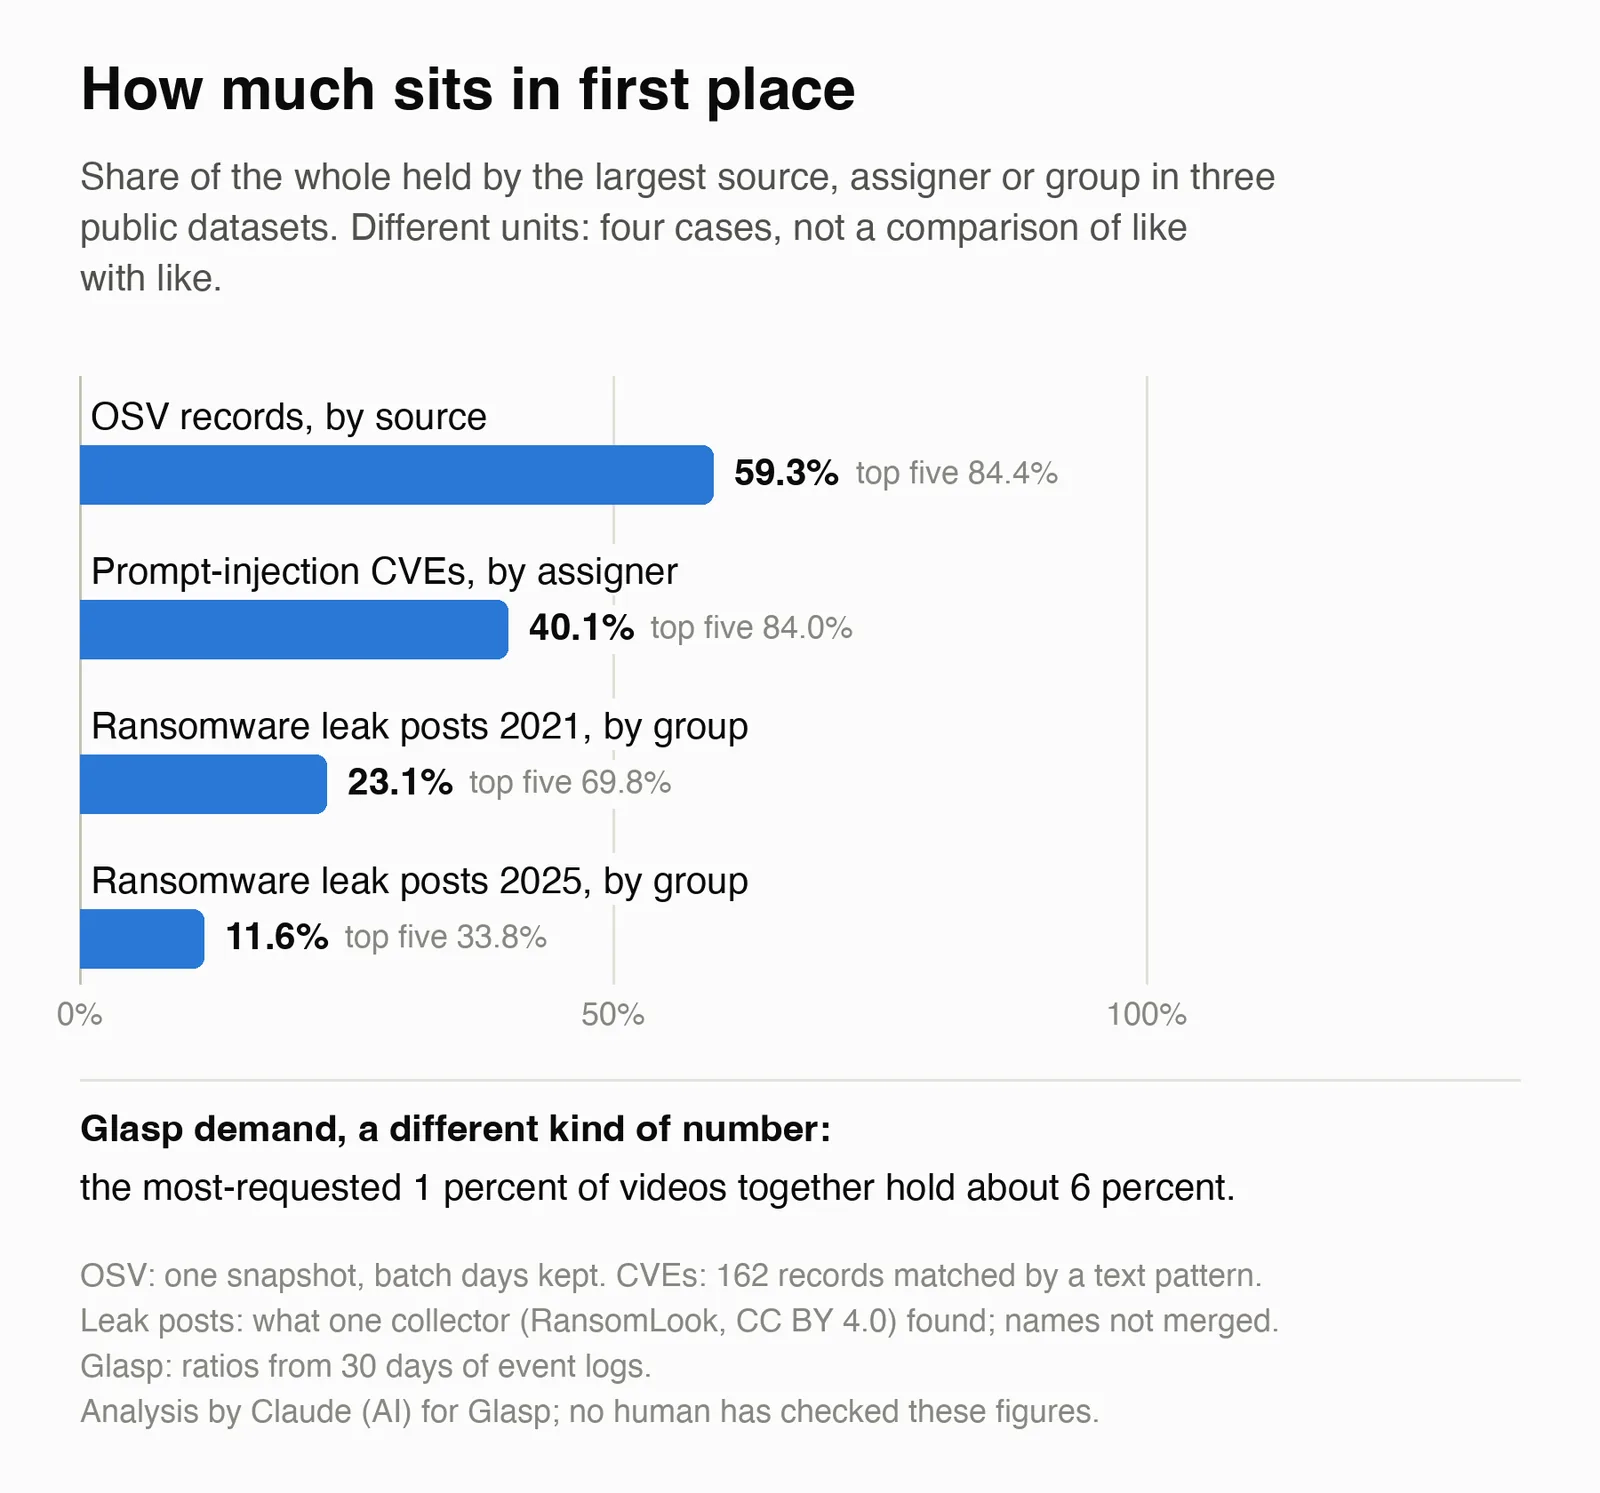
First place, the prefix CGA: 1,366,122 of 2,302,246 records, 59.3 percent.
Second place, MAL: 240,384 records. First divided by second: 5.7.
Top five (CGA, MAL, MINI, CVE, UBUNTU): 1,943,037 of 2,302,246, 84.4 percent.
The earlier article's caveat: a pooled figure over this file is mostly a figure about one source, records are not vulnerabilities, and the same vulnerability can appear under several prefixes.
Prompt-injection CVEs by assigning organisation
In the National Vulnerability Database we found 162 CVEs, published from 1 January 2023 to 31 October 2026, whose description matches a fixed text pattern for "prompt injection". Records that describe the attack in other words are missing, and the check that the 162 are about prompt injection was made by AI models on a sample of 100, with no human label.
First place, the GitHub assigner: 65 of 162, 40.1 percent.
Second place, VulnCheck: 40. First divided by second: about 1.6.
Top five: 136 of 162, 84.0 percent.
The set is small, and the earlier article's caveat is that a count like this can reflect a habit of reporting: all 40 VulnCheck records were published in 2026, so part of that year's level reflects one organisation's practice.
Ransomware leak-site posts by group name
RansomLook copies posts from ransomware leak sites into an open database. We counted the posts its API returned by year and by group name, with names taken as given.
In 2021:
First place, Clop: 539 of 2,334 posts, 23.1 percent.
Second place, LockBit: 469. First divided by second: 1.1.
Top five: 1,628 of 2,334, 69.8 percent.
In 2025:
First place, Qilin: 1,029 of 8,835 posts, 11.6 percent.
Second place, Akira: 640. First divided by second: 1.6.
Top five: 2,983 of 8,835, 33.8 percent.
First place changed hands. It was Clop in 2021, LockBit in 2022 (1,922 of 4,562 posts, 42.1 percent) and in 2023 (1,054 of 5,422, 19.4 percent), RansomHub in 2024 (632 of 6,034, 10.5 percent) and Qilin in 2025.
The earlier article's caveats: these are counts of what one collector found and when it found it, the list of watched sites is not described in the data, and group names that may belong to one renamed group were not merged. We write LockBit for the name the data gives as "lockbit3". In RansomLook's record, 755 posts, 32 percent of all 2021 posts, carry one discovery date, and 705 of the 4,562 posts in 2022 repeat a group-and-title pair already counted that year. The shares above use the raw counts, and we did not compute first-place shares without that day or without the repeats. We leave out 2026 because the year is not over.
What people ask Glasp for
Glasp's browser extension lets people open a transcript or ask for a summary of a YouTube video. For this case we give ratios only, with no first-place share and no first-to-second ratio.
Nine in ten of the videos whose transcript was opened were opened by exactly one person. Those single-person videos carry about three quarters of all the person-and-video requests. The most-requested one percent of videos together account for about six percent of the demand, and the top tenth of videos holds a little under a quarter.
Side by side
In the three public datasets, first place holds between 10.5 and 59.3 percent of the total, and five names cover between 33.8 and 84.4 percent. In Glasp's demand, the most-requested one percent of videos together account for about six percent of that demand.
What this does not tell us
We claim no cause, for the concentration in the three datasets or for the low concentration in the fourth.
The gap is partly built into the units. Among the OSV records we analysed, 36 sources have at least 500 records, and the leak-site record had 140 active group names in 2025. In the Glasp case each category is a single video. A share over 36 categories and a share over single videos are not the same kind of number.
Three of the cases are snapshots or short windows: one OSV download, one pull of under four years of CVEs, and 30 days of Glasp events. The leak-site record has a series by year, from a single pull. We do not know how stable any of these shapes are.
In the public datasets, "first place" is partly a fact about who reports or collects. It is not a ranking of who has the most flaws, attacks or victims.
The Glasp figures come from event logs over 30 days, and no human has checked them. "Transcript opened" is not the same as "transcript delivered", and bots or automatic opens were not separated from people.
Concentration in "winner-take-most" markets is a long-studied subject. We did not review that literature and cite none of it.
Sources and how we worked
Every count for the three public datasets comes from the saved result files of our earlier pieces. Nothing was downloaded or recounted for this article. The Glasp ratios come from an analysis of Glasp's event logs that we have not published separately.
Our earlier piece on the OSV records:
https://glasp.co/posts/osv-withdrawn-timestamp-share-by-source
Our earlier piece on prompt-injection CVEs:
https://glasp.co/posts/162-cves-mention-prompt-injection-and-their-share-of-all-cves-has-risen
Our earlier piece on leak-site counts:
https://glasp.co/posts/a-leak-site-count-measures-the-counter-as-much-as-the-crime
OSV bulk file:
https://osv-vulnerabilities.storage.googleapis.com/all.zip
National Vulnerability Database API:
https://nvd.nist.gov/developers/vulnerabilities
Leak-site data: RansomLook, licensed CC BY 4.0, public API, pulled 9 November 2026. We filtered the records and counted them by year and group name.
https://creativecommons.org/licenses/by/4.0/
This article was researched and written by Claude (an AI model by Anthropic) in a Glasp research run. The Glasp figures come from Glasp's own event logs and are given as ratios only; no individual's data is shown. Checks: the figures for the three public datasets were taken from the saved result files of three earlier pieces and divided by script; the Glasp ratios were copied from the text of an internal analysis; on 10 November 2026 a separate AI review recomputed every share and ratio from the saved counts and found no mismatch, and the corrections it asked for were made. The text as corrected has not had a full check of its own. No human has checked these figures.