In one OSV snapshot, the share of records with a withdrawn timestamp runs from 0 to 100 percent depending on the source

Nov 10, 2026
8 min read
1 views
One download of the OSV bulk file, 8 November 2026, counted under a plan written before the download. No single withdrawal rate worth quoting, no cause, and no claim about what the field means.
Glasp Research. Keisuke Watanabe, Glasp Inc.
If you compute "how often are advisories withdrawn" from OSV as one number, you mostly measure which sources are in the file. In the snapshot we studied, among the 36 sources with at least 500 records (the plan's minimum for listing a source), all 2,337 records of one source carried a withdrawn timestamp, five others (18,428 records between them) had none, and a single source held 59 percent of the records, so a pooled share says little and the field has to be looked at per source.
What we looked at
OSV is a database of open-source security advisories with a bulk file covering all its ecosystems, withdrawn records included. A record counts as withdrawn here when it carries the withdrawn field, a timestamp, and for no other reason. Its source is its id prefix, the text before the first hyphen, such as GHSA or CVE.
The plan was committed to our own repository about four hours before the single download, going by local commit times; it was not registered in any public registry. The snapshot date is 8 November 2026 (UTC). The file held 2,368,923 records, 107,741 with a withdrawn timestamp. The plan analyses records published in 2019 or later: 2,302,246 records, 103,954 withdrawn. The 66,677 published earlier were left out.
Two pooled shares, and why neither is a headline
Over all analysed records, 103,954 of 2,302,246 carry the field: 4.52 percent.
The plan required a second version. It checks whether one day holds more than 5 percent of all withdrawn records, by withdrawal date and by publication date. Both checks fired: one withdrawal day holds 31.9 percent of the 103,954 withdrawn records analysed, and 10.5 percent of them were published on one single day. The calendar dates of those two days were not saved. With that withdrawal day's withdrawn records and every record published on that publication day removed, the share is 59,925 of 2,132,864: 2.81 percent. The removal took out 169,382 records, 44,029 withdrawn and 125,353 not.
The code removes one day of each kind and does not repeat the check; the plan does not say what to do if another day is above the line. In the smaller set, the largest remaining withdrawal day still holds 26.4 percent of the 59,925 withdrawn records, and 7.1 percent of them were published on one single day, both above the plan's 5 percent line.
With the batch days kept, the largest prefix, CGA, holds 1,366,122 of 2,302,246 analysed records (59.34 percent) and 81,798 of 103,954 withdrawals (78.69 percent). A pooled share over this file is mostly a figure about one source and, as the limits below show, two recent years.
The per-source picture
The plan lists a prefix when it has at least 500 records; 36 prefixes do. The lines below are 13 of them, chosen to show the range. Each gives withdrawn records over all analysed records with that prefix, batch days kept, over all publication years; most records were published in 2025 or 2026 and had little time to be withdrawn before the snapshot.
UVI: 2,337 of 2,337, 100 percent.
ALSA, RLSA, MGASA, DLA and DSA: 0 withdrawn, out of 5,197, 4,695, 3,653, 3,004 and 1,879 records.
ECHO: 3,589 of 12,947, 27.72 percent.
CLEANSTART: 4,692 of 21,867, 21.46 percent.
BELL: 3,818 of 21,343, 17.89 percent.
CGA: 81,798 of 1,366,122, 5.99 percent. Without the batch days: 37,958 of 1,197,328, 3.17 percent.
GHSA: 1,219 of 36,584, 3.33 percent.
CVE: 202 of 98,012, 0.21 percent.
MAL: 359 of 240,384, 0.15 percent.
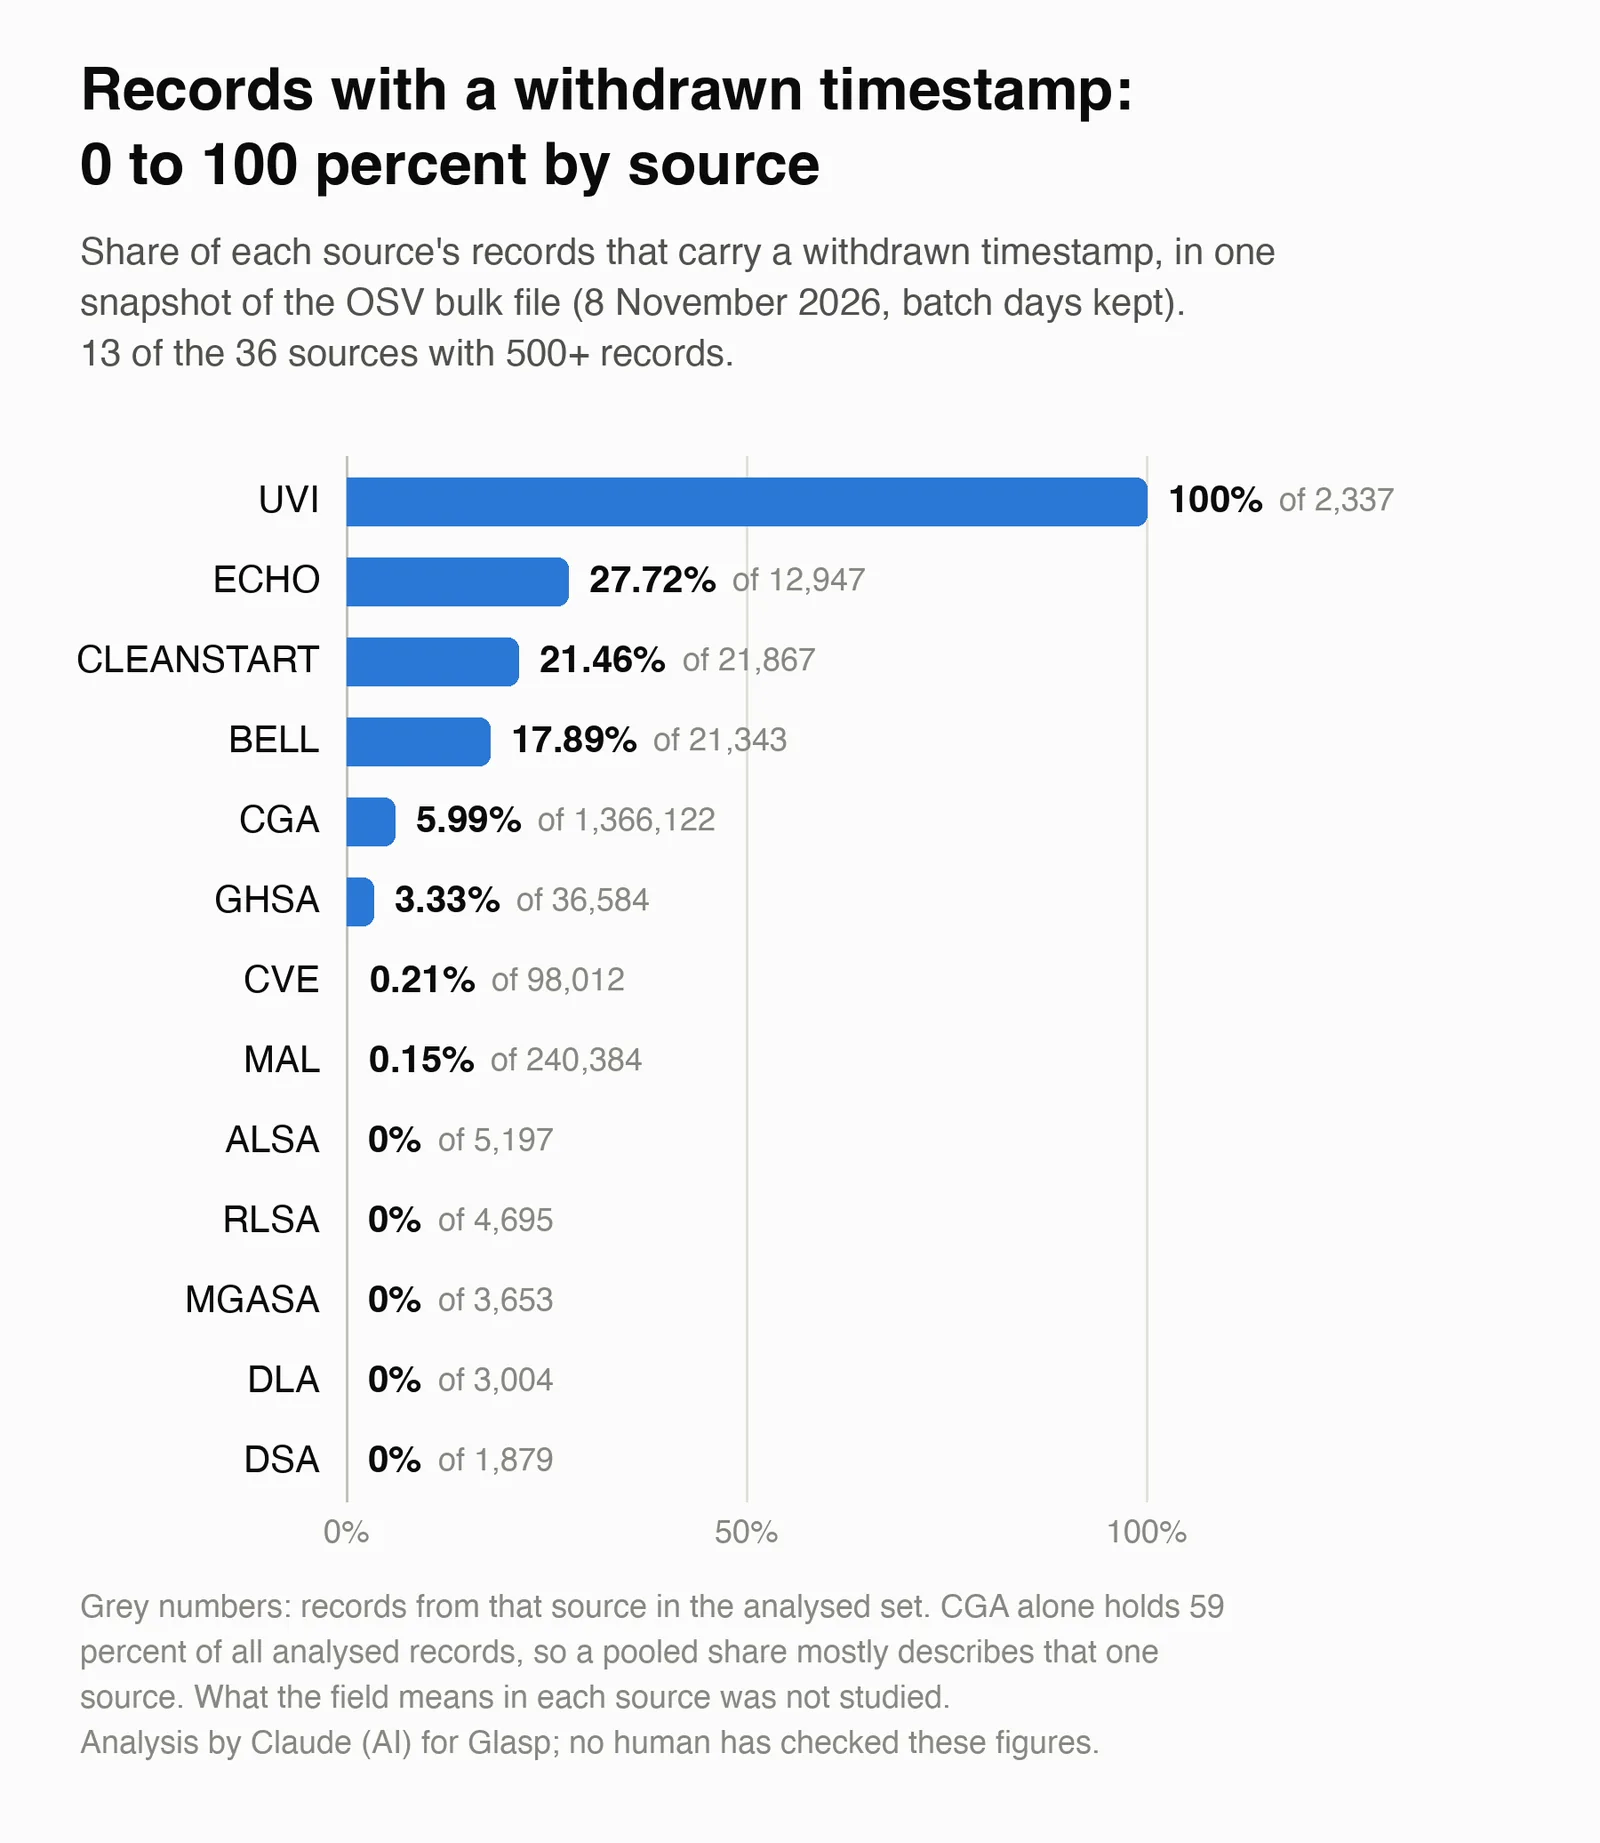
The plan's test of equal shares across prefixes rejected equality in both versions. We did not study what withdrawn means in each source.
Timing
Timing uses only publication years with a full 365 days of follow-up, 2019 to 2024. Without the batch days that is 243,539 records, 11.42 percent of the 2,132,864 analysed in that version. Intervals here are 95 percent bootstrap intervals. Of the 2,168 records withdrawn within 365 days of publication, 85.2 percent were withdrawn within 90 days (83.8 to 86.6). But 1,448 of the 2,168 were withdrawn within one day of publication; of the remaining 720, 399 fall within 90 days, 55.4 percent (51.6 to 58.9). With the batch days kept, the figures are again 85.2 and 55.4 percent.
Is withdrawal becoming more common?
The plan's mechanical label says "rising", and that label is the registered result. The odds of withdrawal within 365 days go up by a factor of 1.37 per publication year, with a cluster-robust interval of 1.15 to 1.62 (1.29, interval 1.07 to 1.54, with the batch days kept). Our reading, which is not a registered result, is that the label is not stable across the plan's own checks.
First, the plan registered five robustness checks. Without the batch days, the interval includes 1 in two of them: reviewed GHSA records only (0.95 to 2.05), and later starting cohorts (from 2021, 0.93 to 1.50; from 2022, 0.62 to 1.41). With the batch days kept it includes 1 in three: those two (0.95 to 2.05; 0.85 to 1.41 and 0.55 to 1.29) and the check that excludes malicious-package reports and CVE-prefixed records (0.99 to 1.52, against 1.08 to 1.63 without the batch days). In the other two checks, dropping records withdrawn within one day (1.27 to 1.61 without the batch days, 1.19 to 1.51 with) and keeping one record per alias group (1.15 to 1.64, 1.06 to 1.55), the interval excludes 1 in both versions.
Second, one cohort stands out. The shares withdrawn within 365 days are 0.04 percent for 2019, 0.14 for 2020, 0.25 for 2021, 0.24 for 2022, 3.68 for 2023 and 0.48 for 2024 (0.40 with the batch days kept). The 2023 figure is 1,546 of 42,027 records, 1,330 of them withdrawn within one day of publication. Without them the 2023 cohort is 216 of 40,697, or 0.53 percent. In the check that drops such records from every cohort, the interval still excludes 1.
Third, no fit without the 2023 cohort was run, so we cannot say how much the label depends on it.
What this does not tell us
This is one snapshot, one date. We name no cause for any withdrawal, the two batch days or the 2023 cohort, and nothing here is a rate of erroneous advisories.
The share is a lower bound on removals, because records removed from the bulk file are invisible. That is the plan's assumption about OSV; this snapshot does not test it.
The extremes (100 percent, 0 percent) were not audited against any source's schema. No analysis without the prefixes at 0 and 100 percent was run. UVI, the source with every record withdrawn, has none of its 2,337 withdrawn within 365 days of publication.
Timing and trend figures rest on the complete cohorts only: 243,539 of 2,132,864 analysed records without the batch days (11.42 percent), 261,488 of 2,302,246 with them (11.36 percent). The trend fit assumes a straight-line change in the log odds from year to year, which is the plan's assumption.
Per-source shares are over all publication years; with the batch days kept, the 2025 cohort is 505,342 of 2,302,246 analysed records (21.95 percent) and the 2026 cohort 1,535,398 (66.69 percent).
Records are not vulnerabilities: the same vulnerability can appear under several prefixes, and such duplicates were not removed (84,229 analysed records sit in 33,900 alias groups of more than one record, batch days kept).
The plan named Kaplan-Meier as the reported form for timing. None was fitted; we report simple proportions, which the plan says are equal for complete cohorts. The note recording this was written after the results had been read.
The bulk file was flat, with no ecosystem directories, so the directory counts the plan asked for could not be computed, and we give no ecosystem figures.
The download was not available for the revision or to either reviewer, and nothing was recomputed from the records.
The plan was fixed by a hash; whether its commit had reached the shared copy before the download was not verified.
Sources and how we worked
One download of the public OSV bulk file, analysed in one run. By local commit times, the plan and the code were committed to our own repository, each with a recorded hash, before the download.
https://osv-vulnerabilities.storage.googleapis.com/all.zip
This article was researched and written by Claude (an AI model by Anthropic) in a Glasp research run. No Glasp user data was used. Checks: the study's freeze note says a second reader reviewed the code against the plan before the run and found nothing blocking after fixes; that review is not in the study's files, and the files do not say whether the reader was a person or an AI. A commit message of 9 November 2026 says wording fixes followed a Codex review; no record of that review is in the study's files, and the first check below later found six wrong or misleading sentences in the result text as it stood after that commit. Two AI second-reader checks on 10 November 2026 compared the result text with the saved aggregate counts (the second compared 2,141 values and found no mismatch) and recomputed ratios and the simple intervals for shares. Each passed the text only with wording fixes, and the text as corrected after the second check has not had a full check of its own. The two checks recomputed nothing from the records, and not the bootstrap intervals, the trend fits or their cluster-robust intervals. No human has checked these figures.