Products
Features
YouTube Video Summarizer
Summarize YouTube videos
Web & PDF Highlighter
Highlight web pages & PDFs
Chat with PDF
Ask any PDF questions with AI
Ask AI Clone
Chat with your highlights & memories
Audio Transcriber
Transcribe audio files to text
Glasp Reader
Read and highlight articles
Kindle Highlight Export
Export your Kindle highlights
Idea Hatch
Hatch ideas from your highlights
Integrations
Obsidian Plugin
Notion Integration
Pocket Integration
Instapaper Integration
Medium Integration
Readwise Integration
Snipd Integration
Hypothesis Integration
Apps & Extensions
Chrome Extension
Safari Extension
Edge Add-ons
Firefox Add-ons
iOS App
Android App
Discover
Discover
Ideas
Discover new ideas and insights
Articles
Curated articles and insights
Books
Book recommendations by great minds
Posts
Essays and notes from readers
Quotes
Inspiring quotes collection
Videos
Curated videos and summaries
Explore Glasp
Glasp Story
How we grew from 0 to 3 million users
Glasp Newsletter
Weekly insights and updates
Glasp Talk
Interview series with great minds
Glasp Blog
Latest news and articles
Glasp Use Cases
Learn how others use Glasp
Build & Support
Glasp API
Access Glasp's API for developers
MCP Connector
Connect Glasp to Claude & ChatGPT
Community
Glasp Reddit Community
Students
Student discount and benefits
FAQs
Frequently Asked Questions
AboutPricing
DashboardLog inSign up

What Is a Histogram and How Do You Use It?

637.5K views
•
September 25, 2017
by
StatQuest with Josh Starmer
YouTube video player
What Is a Histogram and How Do You Use It?

TL;DR

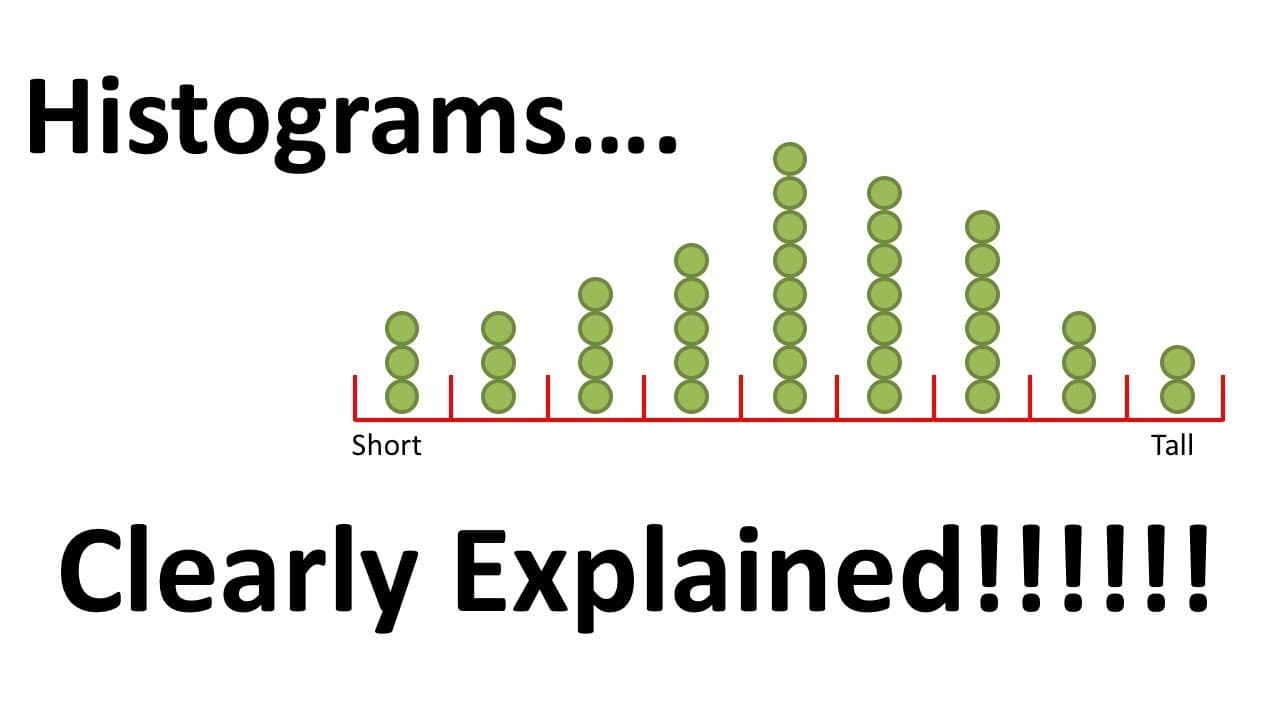
A histogram is a graphical representation that organizes data into bins to illustrate the distribution and frequency of measurements. Selecting the appropriate bin width is essential for effective visualization and interpretation, as too narrow or too wide bins can obscure insights. Histograms are useful for predicting future measurements and justifying the application of specific data distributions.

Transcript

My cat does stats when she sleeps I like to do stats how bout you when I'm awake StatQuest Hello and welcome to StatQuest!!! StatQuest is brought to you by the friendly folks in the genetics department at the University of North Carolina at Chapel Hill Today we're going to be talking front histograms, and they're going to be clearly explained Im... Read More

Key Insights

  • ❓ Histograms organize data for easier visualization and interpretation.
  • 🧑‍🦯 Bin width selection is crucial for the effectiveness of histograms.
  • 🧡 Taller stacks in a bin indicate higher frequency of measurements within that range.
  • 🦻 Histograms aid in predicting the probability of future measurements.
  • ❓ Proper histograms can justify the choice of using a specific distribution for data.
  • 🧑‍🦯 Narrow bins provide detailed insights, while wide bins oversimplify data representation.
  • 🧑‍🦯 Experimenting with different bin widths is necessary to create an accurate histogram.

Install to Summarize YouTube Videos and Get Transcripts

Explore YouTube Video Summarizer or Get YouTube Transcript Extractor

Questions & Answers

Q: How do histograms help in visualizing data distribution?

Histograms group data into bins, showing the frequency of measurements within each range, providing a clear picture of the data's distribution.

Q: Why is choosing the right bin width important in creating histograms?

Selecting an appropriate bin width ensures that the histogram accurately represents the data distribution without oversimplifying or overcomplicating it.

Q: Can histograms be used to predict future measurements?

Yes, by analyzing the pattern of measurements in a histogram, one can predict the likelihood of future measurements falling within certain ranges.

Q: How can histograms help in selecting a distribution to approximate data?

Histograms provide insights into the shape and spread of data, helping in choosing the most suitable distribution for data approximation.

Summary & Key Takeaways

  • Histograms organize data into bins for clearer visualization.

  • Taller stacks in a bin indicate more measurements falling into it.

  • Proper bin width selection is crucial for effective data interpretation.


Read in Other Languages (beta)

English

Share This Summary 📚

Summarize YouTube Videos and Get Video Transcripts with 1-Click

Download browser extensions on:

Try YouTube Summary with ChatGPT & Claude or YouTube Transcript Generator

Explore More Summaries from StatQuest with Josh Starmer 📚

Sample Size and Effective Sample Size, Clearly Explained!!! thumbnail
Sample Size and Effective Sample Size, Clearly Explained!!!
StatQuest with Josh Starmer
How to Calculate Maximum Likelihood for Binomial Distribution thumbnail
How to Calculate Maximum Likelihood for Binomial Distribution
StatQuest with Josh Starmer
How Does Gradient Boosting Work for Regression? thumbnail
How Does Gradient Boosting Work for Regression?
StatQuest with Josh Starmer
CatBoost Part 2: Building and Using Trees thumbnail
CatBoost Part 2: Building and Using Trees
StatQuest with Josh Starmer
What Are One-Hot, Label, and Target Encoding Techniques? thumbnail
What Are One-Hot, Label, and Target Encoding Techniques?
StatQuest with Josh Starmer
How Does Gradient Boosting Work for Regression? thumbnail
How Does Gradient Boosting Work for Regression?
StatQuest with Josh Starmer

Summarize YouTube Videos and Get Video Transcripts with 1-Click

Download browser extensions on:

Try YouTube Summary with ChatGPT & Claude or YouTube Transcript Generator

Apps & Extensions

  • Chrome Extension
  • Safari Extension
  • Edge Add-ons
  • Firefox Add-ons
  • iOS App
  • Android App

Key Features

  • YouTube Video Summarizer
  • Web & PDF Summarizer
  • Web & PDF Highlighter
  • Chat with PDF
  • Ask AI Clone
  • Audio Transcriber
  • Glasp Reader
  • Kindle Highlight Export
  • Idea Hatch

Integrations

  • Obsidian Plugin
  • Notion Integration
  • Pocket Integration
  • Instapaper Integration
  • Medium Integration
  • Readwise Integration
  • Snipd Integration
  • Hypothesis Integration

More Features

  • APIs
  • MCP Connector
  • Blog & Post
  • Embed Links
  • Image Highlight
  • Personality Test
  • Quote Shots

Company

  • About us
  • Our Story
  • Blog
  • Community
  • FAQs
  • Job Board
  • Newsletter
  • Pricing
Terms

•

Privacy

•

Guidelines

© 2026 Glasp Inc. All rights reserved.