How to Perform Multiple Regression Analysis in R
TL;DR
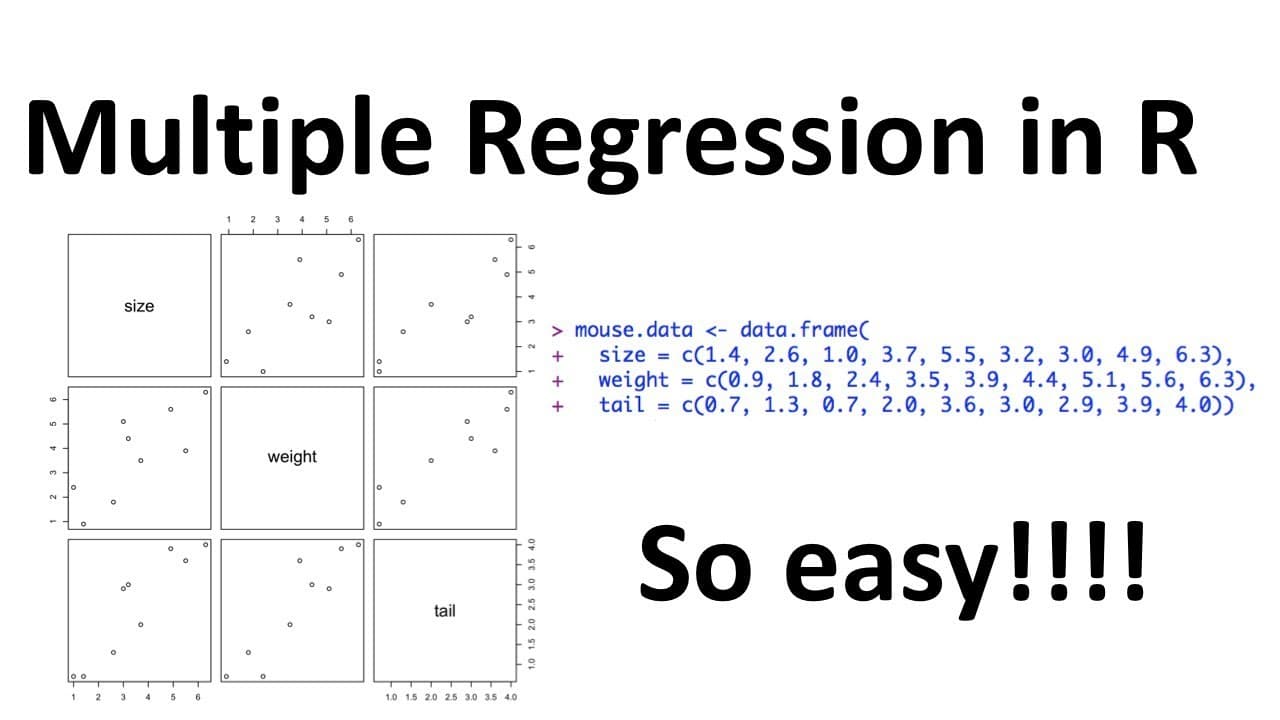
To perform multiple regression analysis in R, begin by plotting your data to visualize relationships. Use the LM function to fit a model that predicts size using weight and tail lengths. The analysis shows that both predictors are valid, but tail lengths alone can effectively predict size, making it a simpler option.
Transcript
stat quest is totes cray-cray stat quest hello I'm Josh stormer and welcome to stat quest stat quest is brought to you by the friendly folks in the genetics department at the University of North Carolina at Chapel Hill today we're going to compare simple and multiple regression and our and just so you know the R code used in this video is available... Read More
Key Insights
- ❓ Plotting data is an essential step in evaluating whether a linear regression is appropriate.
- 👋 Weight is a good predictor for size in simple regression.
- 🍸 Both weight and tail lengths are reasonable predictors for size in multiple regression, but using only tail lengths is sufficient.
Install to Summarize YouTube Videos and Get Transcripts
Explore YouTube Video Summarizer or Get YouTube Transcript Extractor
Questions & Answers
Q: What is the purpose of plotting data in regression analysis?
Plotting data in regression analysis helps evaluate whether a linear regression is appropriate by visualizing the relationship between variables.
Q: What does the R-squared value indicate in simple regression?
The R-squared value of 0.613 suggests that weight does a fairly good job of predicting size in simple regression.
Q: How do weight and tail lengths correlate with size in multiple regression?
Both weight and tail lengths are correlated with size in multiple regression, indicating that they are reasonable predictors for size.
Q: Is using both weight and tail lengths significantly better than using only tail lengths to predict size?
No, the p-value suggests that using both weight and tail lengths is not significantly better than using only tail lengths to predict size.
Key Insights:
- Plotting data is an essential step in evaluating whether a linear regression is appropriate.
- Weight is a good predictor for size in simple regression.
- Both weight and tail lengths are reasonable predictors for size in multiple regression, but using only tail lengths is sufficient.
- Using both weight and tail lengths does not significantly improve the prediction of size compared to using only one predictor.
Summary & Key Takeaways
-
The video compares simple and multiple regressions using weight as a predictor for size.
-
Simple regression shows that weight is a good predictor for size.
-
Multiple regression shows that both weight and tail lengths are correlated with size, but using tail lengths alone is sufficient to predict size.
Read in Other Languages (beta)
Share This Summary 📚
Summarize YouTube Videos and Get Video Transcripts with 1-Click
Try YouTube Summary with ChatGPT & Claude or YouTube Transcript Generator
Explore More Summaries from StatQuest with Josh Starmer 📚


Summarize YouTube Videos and Get Video Transcripts with 1-Click
Try YouTube Summary with ChatGPT & Claude or YouTube Transcript Generator