How to Perform a Repeated Measures ANOVA in GraphPad Prism
TL;DR
To perform a repeated measures ANOVA in GraphPad Prism, organize your data with subjects in rows and select 'one-way ANOVA' from the analysis options. Follow the prompts to specify that your data are repeated measures, choose necessary post hoc tests, and check assumptions for accurate results. This method allows you to identify significant differences in outcomes measured at multiple time points.
Transcript
hello I'm James Clark from King's College London and in this brief walkthrough I'm going to show you how to undertake the steps needed to do a repeated measure one-way ANOVA in graphpad prism a one-way ANOVA is the statistical test required to compare three or more groups of data under some circumstances however you may find that your groups are re... Read More
Key Insights
- 😥 A repeated measures ANOVA is appropriate when comparing data from the same subjects at different time points.
- 🤨 Adding row titles to the data table improves clarity and organization in the analysis.
- ✊ Visualizing the data using a before-and-after plot helps identify consistent patterns and increases the power of the analysis.
- 😥 Multiple comparisons can be used to identify specific differences between the time points.
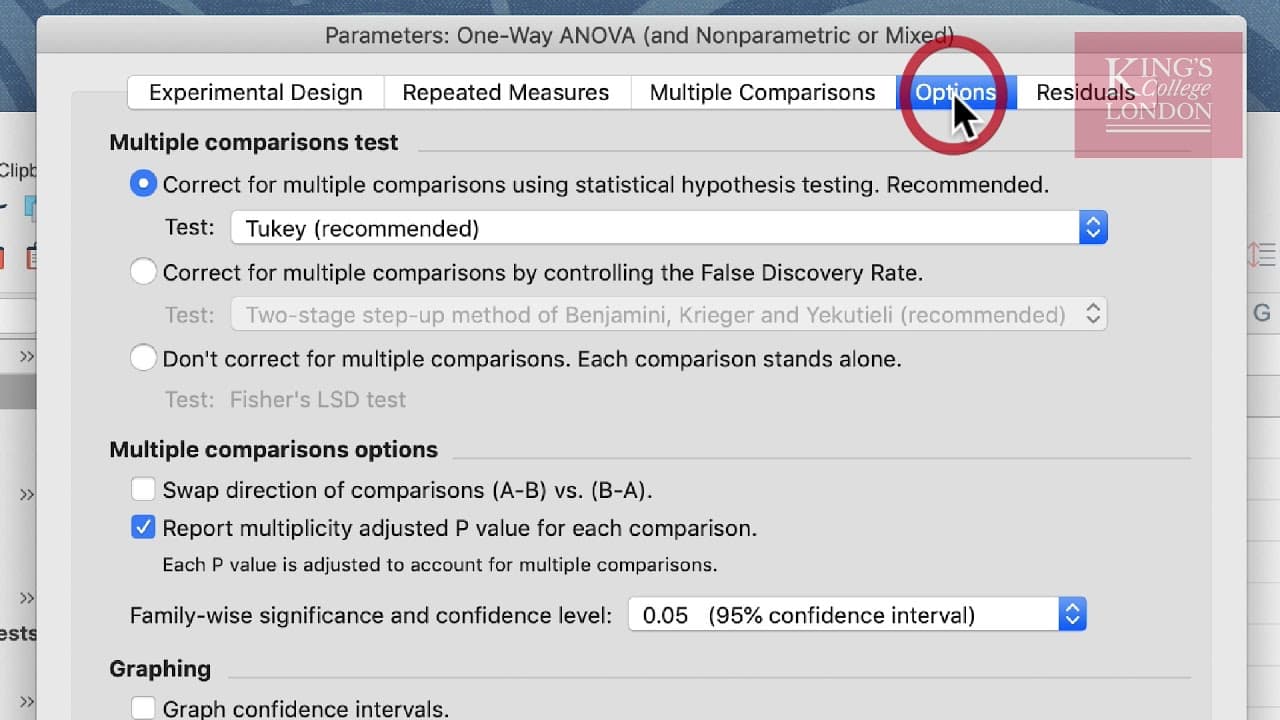
- 🫢 The choice of post hoc test, such as Bonferroni or Tukey, depends on the specific requirements of the analysis.
- 🍵 GraphPad Prism offers various analysis options, including mixed effects models for handling missing values.
- ✅ Checking assumptions, like Gaussian distribution, is essential for accurate analysis.
Install to Summarize YouTube Videos and Get Transcripts
Explore YouTube Video Summarizer or Get YouTube Transcript Extractor
Questions & Answers
Q: Why is a repeated measures ANOVA suitable for analyzing the given data?
A repeated measures ANOVA is suitable because the data involve measuring heart rate at different time points within the same subjects. This allows us to determine if there are significant differences in heart rate over time for each participant.
Q: How can row titles be added to the data table in GraphPad Prism?
Row titles can be added by clicking on the "Show Row Titles" tool in the Format Data Table box. This allows for easier identification of each subject's data in the table.
Q: What is the advantage of using a before-and-after plot to visualize the data?
A before-and-after plot visually illustrates the individual changes in heart rate for each subject, making it easier to see consistent increases in heart rate from 3 to 6 minutes of exercise. This strengthens the power of the analysis and helps determine the significance of the increase.
Q: How can multiple comparisons be conducted in GraphPad Prism?
Multiple comparisons can be conducted by selecting the relevant option in the Parameters window of the one-way ANOVA analysis. In this case, comparing the mean of each column with the mean of every other column is chosen to determine the differences between the time points.
Summary & Key Takeaways
-
This video tutorial provides a step-by-step guide on conducting a repeated measures ANOVA in GraphPad Prism.
-
The data used in the tutorial consists of heart rate measurements taken at resting, three minutes, and six minutes of exercise for seven participants.
-
By analyzing the data using a repeated measures ANOVA, the tutorial demonstrates how to determine significant differences in heart rate among the different time points.
Read in Other Languages (beta)
Share This Summary 📚
Summarize YouTube Videos and Get Video Transcripts with 1-Click
Try YouTube Summary with ChatGPT & Claude or YouTube Transcript Generator
Explore More Summaries from Dory Video 📚


Summarize YouTube Videos and Get Video Transcripts with 1-Click
Try YouTube Summary with ChatGPT & Claude or YouTube Transcript Generator