What Is Least Squares and How Does It Fit Data?
TL;DR
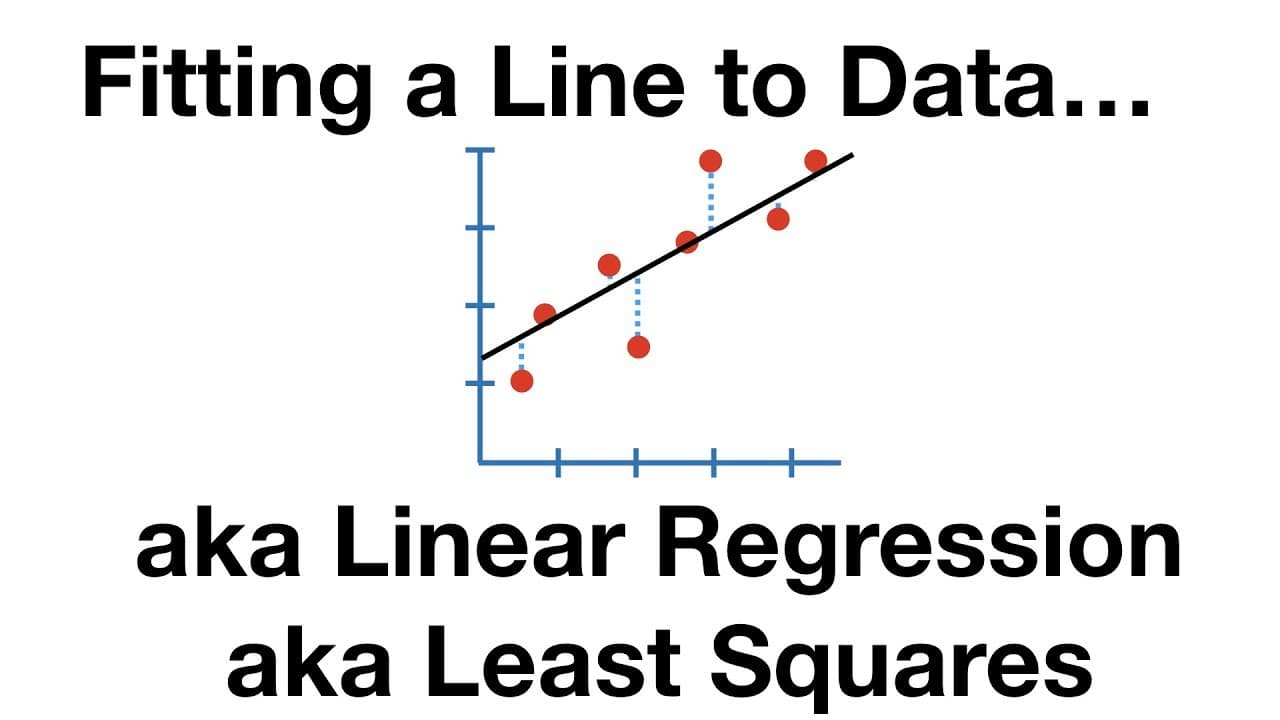
Least squares is a method for fitting a line to data that minimizes the sum of squared residuals, which represent the distance between observed values and the line. The optimal slope and intercept of the line are determined by adjusting these parameters to achieve the best fit, often visualized through rotating the line until the least squares value is minimized.
Transcript
When we go on a quest and that quest is really awesome. It's that StatQuest Yeah, yeah, yeah Hello, and welcome to StatQuest. StatQuest is brought to you by the friendly folks in the genetics Department at the University of North Carolina at Chapel Hill. Today, we're going to talk about fitting a line to Data. aka Least Squares aka Linear regressio... Read More
Key Insights
- 🫥 Fitting a line to data using least squares helps us understand trends and relationships in the data.
- 🫥 The fit of a line to data can be measured using the sum of squared residuals.
- 🫥 Rotating the line can improve or worsen the fit, and there is a sweet spot where the fit is optimal.
Install to Summarize YouTube Videos and Get Transcripts
Explore YouTube Video Summarizer or Get YouTube Transcript Extractor
Questions & Answers
Q: What is the purpose of fitting a line to data using least squares?
The purpose is to find the line that minimizes the sum of squared residuals, representing the distance between the observed values and the line. This helps us understand the trend and relationship between variables in the data.
Q: How do we measure the fit of a line to data using least squares?
The fit is measured by calculating the sum of squared residuals. This involves taking the difference between the observed data points and the corresponding points on the line, squaring them, and summing them up.
Q: Why is rotating the line important in fitting a line to data?
Rotating the line allows us to explore different slopes and intercepts, which can improve or worsen the fit. By finding the optimal rotation, we can determine the line that gives the least squares between the line and the real data.
Q: How do we find the optimal values for the slope and intercept of the line?
We find the optimal values by taking the derivative of the sum of squared residuals with respect to the slope and intercept. At the point where the derivatives are equal to zero, we have the optimal values that minimize the sum of squared residuals.
Key Insights:
- Fitting a line to data using least squares helps us understand trends and relationships in the data.
- The fit of a line to data can be measured using the sum of squared residuals.
- Rotating the line can improve or worsen the fit, and there is a sweet spot where the fit is optimal.
- The optimal values for the slope and intercept of the line can be found by taking the derivative of the sum of squared residuals, leading to the concept of least squares.
Summary & Key Takeaways
-
This video discusses the process of fitting a line to data using least squares or linear regression.
-
It explains how to measure the fit of a line to data by calculating the sum of squared residuals.
-
The video demonstrates how rotating the line can improve or worsen the fit, and introduces the concept of finding the optimal values for the slope and intercept of the line.
Read in Other Languages (beta)
Share This Summary 📚
Summarize YouTube Videos and Get Video Transcripts with 1-Click
Try YouTube Summary with ChatGPT & Claude or YouTube Transcript Generator
Explore More Summaries from StatQuest with Josh Starmer 📚





Summarize YouTube Videos and Get Video Transcripts with 1-Click
Try YouTube Summary with ChatGPT & Claude or YouTube Transcript Generator