ICT Emini S&P 500 Review - March 27, 2023

TL;DR
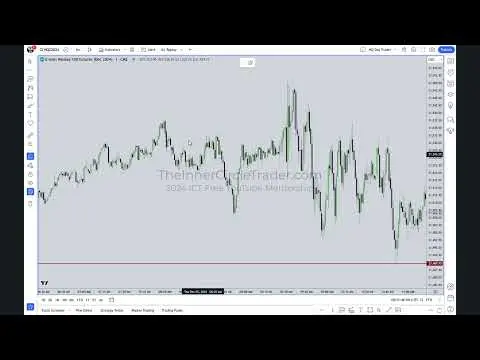
Key levels and areas of interest were identified on the daily, hourly, 15-minute, 5-minute, and 1-minute charts for the E-mini S&P Futures Contract for June 2023.
Transcript
well good evening folks taking a look at the e-mini s p Futures Contract for June 2023 this is our daily chart here and I want to cover some of the points I'll be looking for tomorrow in terms of key levels and areas of Interest all right so here is the premium fair value gaps outside and balance Boston and efficiency or City and consequent encoura... Read More
Key Insights
- 👻 The analysis covers multiple timeframes, allowing for a comprehensive understanding of market dynamics.
- *️⃣ Key levels such as fair value gaps, imbalances, and discount wicks are crucial in determining potential support and resistance areas.
- 🎴 Algorithmic price delivery and institutional order flow play significant roles in driving price movements.
- 💯 The opening range gap provides a reference point for potential trade setups.
- 📊 Transposing the analysis onto personal charts enhances its meaningfulness and applicability to individual trading strategies.
- 🎱 Technical indicators such as swings in market structure and buy/sell liquidity pools provide additional confirmation for trade entries and exits.
- ❓ The analysis emphasizes the importance of studying price action and mapping out potential scenarios to enhance trading strategies.
Install to Summarize YouTube Videos and Get Transcripts
Explore YouTube Video Summarizer or Get YouTube Transcript Extractor
Questions & Answers
Q: What are the key levels and areas of interest identified in the analysis?
The analysis identified key levels such as premium fair value gaps, imbalances, and discount wicks on the daily chart. It also identified buy side and sell side interest on the hourly chart. Breakers, fair value gaps, and swings in market structure were observed on the 15-minute, 5-minute, and 1-minute charts.
Q: How are algorithmic price delivery and institutional order flow used in the analysis?
Algorithmic price delivery is used to identify potential price swings and liquidity runs in the market. Institutional order flow is observed to determine optimal trade entries and exits. Both factors help in understanding market dynamics and making informed trading decisions.
Q: How is the opening range gap used in the analysis?
The opening range gap is used as a reference point for potential price movements. If the market opens higher than the previous day's settlement, it is likely to trade back down into the opening range gap. This level can act as either support or resistance depending on the direction of the market.
Q: Why is transposing the analysis onto personal charts important?
Transposing the analysis onto personal charts allows traders to visualize the identified levels and patterns in the context of their own trading setups. It helps in understanding the significance of these levels and making more informed trading decisions.
Key Insights:
- The analysis covers multiple timeframes, allowing for a comprehensive understanding of market dynamics.
- Key levels such as fair value gaps, imbalances, and discount wicks are crucial in determining potential support and resistance areas.
- Algorithmic price delivery and institutional order flow play significant roles in driving price movements.
- The opening range gap provides a reference point for potential trade setups.
- Transposing the analysis onto personal charts enhances its meaningfulness and applicability to individual trading strategies.
- Technical indicators such as swings in market structure and buy/sell liquidity pools provide additional confirmation for trade entries and exits.
- The analysis emphasizes the importance of studying price action and mapping out potential scenarios to enhance trading strategies.
- The identification of optimal trade entries and exits relies on understanding the relationship between various levels and patterns in the market.
Summary & Key Takeaways
-
The analysis focuses on key levels, fair value gaps, imbalances, and discount wicks on different timeframes of the E-mini S&P Futures Contract.
-
Buy and sell liquidity pools were identified, along with breakers and swings in market structure.
-
The opening range gap, algorithmic price delivery, and institutional order flow were observed to determine potential trade entries and exits.
Read in Other Languages (beta)
Share This Summary 📚
Summarize YouTube Videos and Get Video Transcripts with 1-Click
Try YouTube Summary with ChatGPT & Claude or YouTube Transcript Generator
Explore More Summaries from The Inner Circle Trader 📚


Summarize YouTube Videos and Get Video Transcripts with 1-Click
Try YouTube Summary with ChatGPT & Claude or YouTube Transcript Generator