AD Instruments LabChart Spirometry Pod calibration and Drift
TL;DR
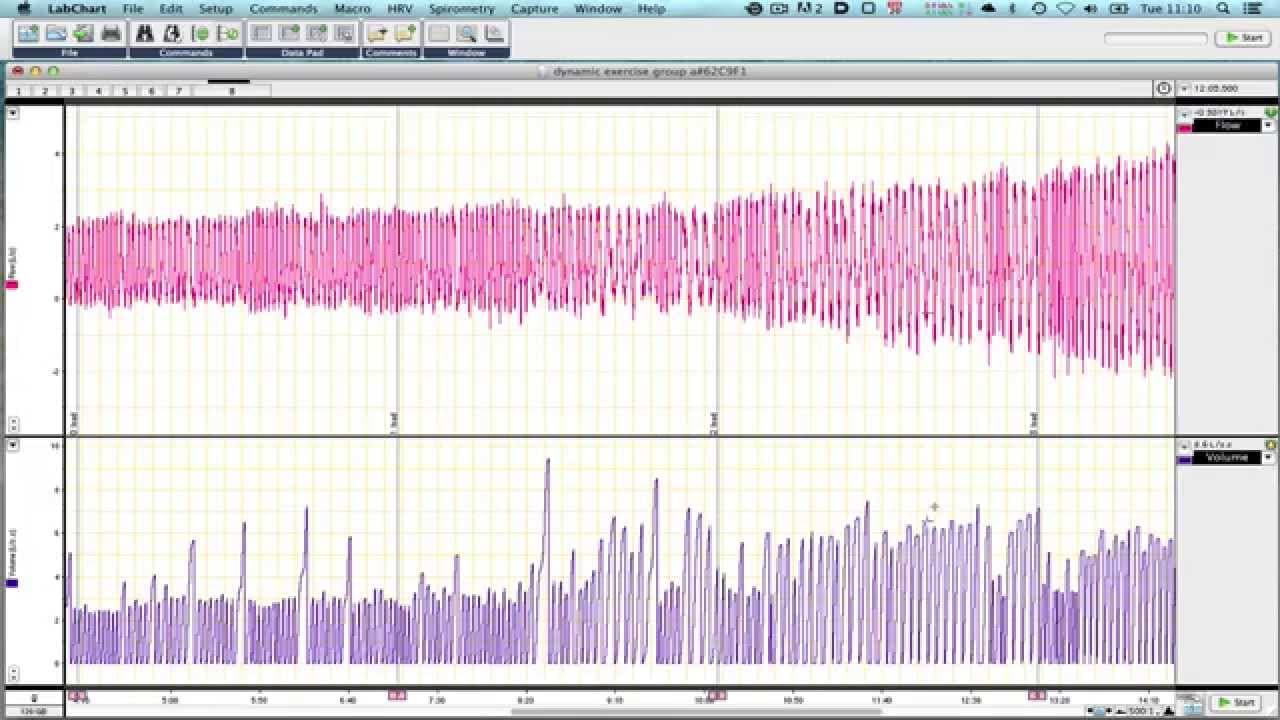
This tutorial explains how to analyze spirometry data, including flow and volume, using Lab Chart 7 software.
Transcript
hello we're looking at some data from a physiology practical here where we've recorded blood pressure heart rate oxygen saturation and respiratory flow and volume and cement tidal gases this is one of the standard incremental exercise protocols we do in most physiology practicals and this tutorial is aiming to look at the spirometry data the flow a... Read More
Key Insights
- 💐 The tutorial focuses on analyzing spirometry data in a physiology practical, specifically flow and volume measurements.
- 🍓 Lab Chart 7 with the spirometry module is recommended for loading and analyzing the raw data.
- ❓ Calibration and drift correction techniques are crucial for accurate data representation.
- 🧑🦽 Manual integration can be used as a workaround if the integration feature does not function properly.
- 🦕 The tutorial highlights the limitations of spirometry pods and suggests alternative approaches for data analysis.
- ❓ The tutorial complements other spirometry tutorials available on the site.
- 🏃 The analyzed data can reveal respiratory volume changes during incremental exercise protocols.
Install to Summarize YouTube Videos and Get Transcripts
Explore YouTube Video Summarizer or Get YouTube Transcript Extractor
Questions & Answers
Q: What data can be recorded in a physiology practical using a spirometry pod?
In a physiology practical, a spirometry pod can record data such as blood pressure, heart rate, oxygen saturation, and respiratory flow and volume.
Q: How can calibration information be lost when loading data on different platforms?
When data recorded and saved on a PC is loaded on a Mac or vice versa, calibration information may be lost, resulting in incorrect data representation.
Q: How can spirometry data be analyzed using Lab Chart 7?
To analyze spirometry data in Lab Chart 7, the spirometry module should be installed. The flow channel should be set to "spirometry flow," and the volume channel should be set to "spirometry volume" with recommended default settings.
Q: How can manual integration be used to analyze volume data?
If the integration feature in the spirometry module does not work properly, manual integration can be used. By selecting the "integral" option and choosing the flow as the source, positive only integration with a reset on each cycle, accurate volume data can be obtained.
Summary & Key Takeaways
-
The tutorial focuses on analyzing spirometry data in a physiology practical, specifically blood pressure, heart rate, oxygen saturation, and respiratory flow and volume.
-
Lab Chart 7 software with the spirometry module is used to load and visualize the raw data.
-
Calibration, drift correction, and manual integration techniques are explained to accurately analyze the flow and volume data.
Read in Other Languages (beta)
Share This Summary 📚
Summarize YouTube Videos and Get Video Transcripts with 1-Click
Try YouTube Summary with ChatGPT & Claude or YouTube Transcript Generator
Explore More Summaries from Dory Video 📚


Summarize YouTube Videos and Get Video Transcripts with 1-Click
Try YouTube Summary with ChatGPT & Claude or YouTube Transcript Generator