Graphpad prism - Annotating Graphs
TL;DR
Learn how to effectively annotate your graphs in Prism with various options like arrows, capped lines, and shaded boxes.
Transcript
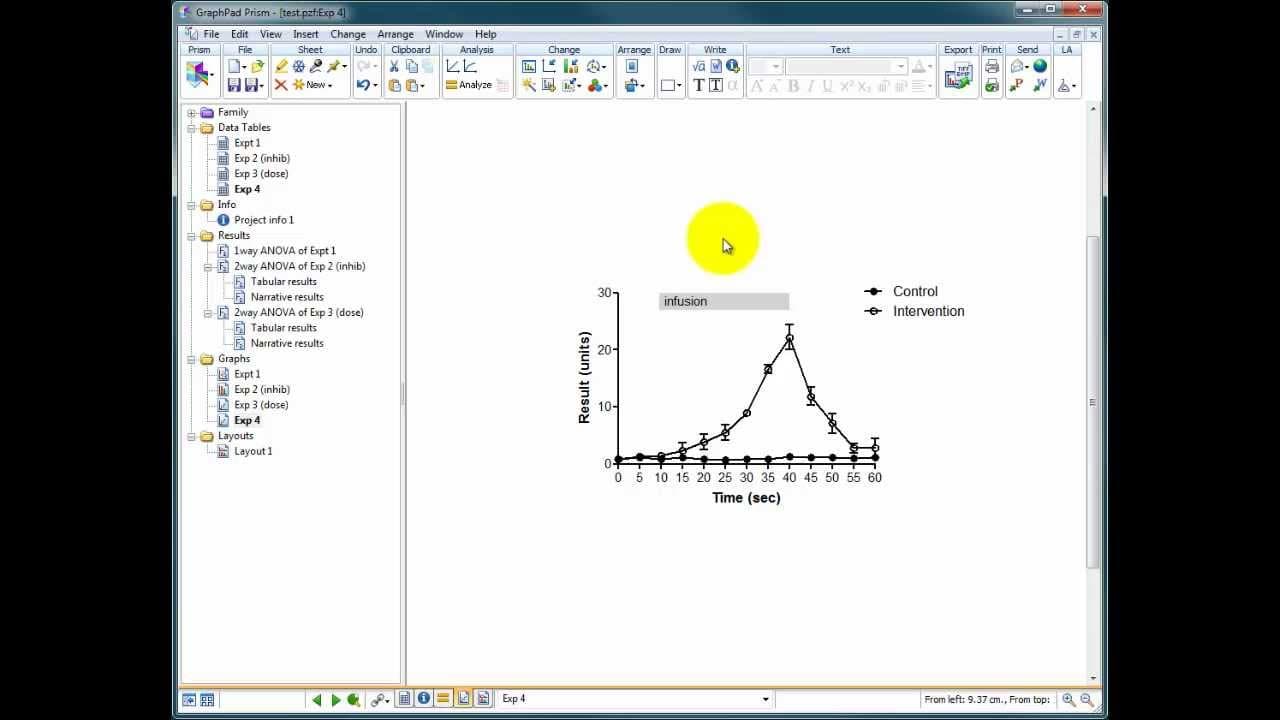
okay I'm just going to show you some very very quick annotation options you've got in prism to make your graphs look interesting and try and explain the data better the this is another set of made-up data we're looking at two conditions a control and an intervention we've got a result and something's happening while we were intervening that we goin... Read More
Key Insights
- 🏙️ Graph annotation options in Prism, such as arrows, capped lines, and shaded boxes, offer flexibility in visually representing important information.
- 🦻 Annotated graphs provide additional context and can aid in data interpretation.
- 🫥 Customization features, like adjusting line thickness or box color, allow for added visual appeal and clarity in the graph.
- 📈 Annotated graphs can be more informative and engaging than relying solely on a legend for understanding the data.
- 👨🔬 Properly annotated graphs contribute to effective communication and presentation of research findings.
- ❓ Choosing the appropriate annotation option depends on the specific requirements and preferences of the researcher.
- 💁 Annotations can help researchers convey complex information in a concise and visually appealing manner.
Install to Summarize YouTube Videos and Get Transcripts
Explore YouTube Video Summarizer or Get YouTube Transcript Extractor
Questions & Answers
Q: How can Prism's annotation options make graphs more visually appealing and informative?
Prism's annotation tools, such as drawing arrows, capped lines, or shaded boxes, allow users to visually represent important details like the start and end of interventions. These annotations make the graph more engaging and easier to interpret.
Q: What are the advantages of using capped lines as annotations in Prism?
By using capped lines, users can create bars at the top of the graph to indicate specific time periods or events. The thickness and direction of the lines can be customized, and text can be added to provide further details. This annotation option is particularly useful for visually highlighting relevant information.
Q: How can shaded boxes be used for graph annotation in Prism?
With Prism's rectangle tool, users can draw shaded boxes to highlight specific regions on the graph. These boxes can be customized in terms of size, position, and color. Annotations can be added within the box, providing additional context or labeling for interventions or other important data points.
Q: Why is it important to have properly annotated graphs in research studies?
Properly annotated graphs enhance the presentation and understanding of research data. They provide visual cues, allowing readers to quickly grasp key information without having to solely rely on a legend. Annotations can also help researchers communicate findings more effectively.
Summary & Key Takeaways
-
Prism offers a range of annotation tools to make graphs more visually appealing and improve data interpretation.
-
Options include drawing arrows to indicate the start and end of interventions, using capped lines to create a bar at the top of the graph, or using shaded boxes as annotations.
-
Properly annotated graphs provide a clear understanding of the data and can be more informative than just a legend.
Read in Other Languages (beta)
Share This Summary 📚
Summarize YouTube Videos and Get Video Transcripts with 1-Click
Try YouTube Summary with ChatGPT & Claude or YouTube Transcript Generator
Explore More Summaries from Dory Video 📚


Summarize YouTube Videos and Get Video Transcripts with 1-Click
Try YouTube Summary with ChatGPT & Claude or YouTube Transcript Generator