Products
Features
YouTube Video Summarizer
Summarize YouTube videos
Web & PDF Highlighter
Highlight web pages & PDFs
Chat with PDF
Ask any PDF questions with AI
Ask AI Clone
Chat with your highlights & memories
Audio Transcriber
Transcribe audio files to text
Glasp Reader
Read and highlight articles
Kindle Highlight Export
Export your Kindle highlights
Idea Hatch
Hatch ideas from your highlights
Integrations
Obsidian Plugin
Notion Integration
Pocket Integration
Instapaper Integration
Medium Integration
Readwise Integration
Snipd Integration
Hypothesis Integration
Apps & Extensions
Chrome Extension
Safari Extension
Edge Add-ons
Firefox Add-ons
iOS App
Android App
Discover
Discover
Ideas
Discover new ideas and insights
Articles
Curated articles and insights
Books
Book recommendations by great minds
Posts
Essays and notes from readers
Quotes
Inspiring quotes collection
Videos
Curated videos and summaries
Explore Glasp
Glasp Story
How we grew from 0 to 3 million users
Glasp Newsletter
Weekly insights and updates
Glasp Talk
Interview series with great minds
Glasp Blog
Latest news and articles
Glasp Use Cases
Learn how others use Glasp
Build & Support
Glasp API
Access Glasp's API for developers
MCP Connector
Connect Glasp to Claude & ChatGPT
Community
Glasp Reddit Community
Students
Student discount and benefits
FAQs
Frequently Asked Questions
AboutPricing
DashboardLog inSign up

What Are Quartiles, Deciles, and Percentiles in Statistics?

January 17, 2019
by
The Organic Chemistry Tutor
YouTube video player
What Are Quartiles, Deciles, and Percentiles in Statistics?

TL;DR

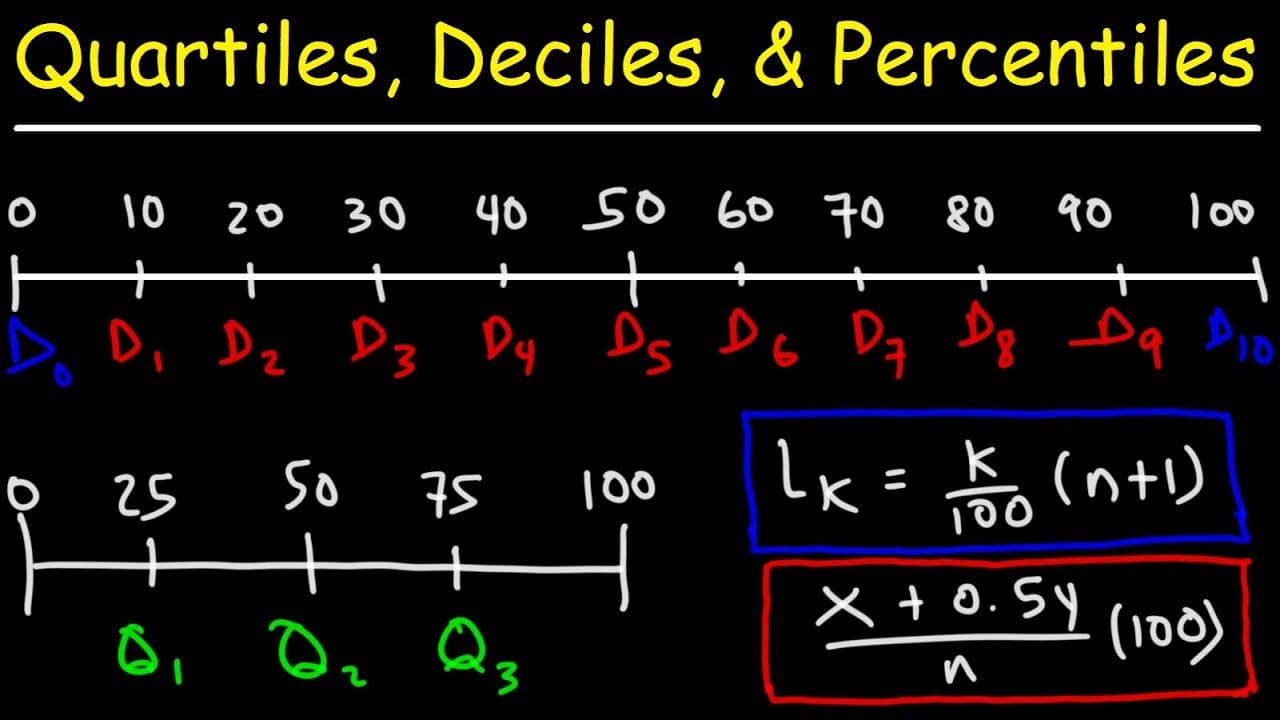
Quartiles divide data into four equal parts, with Q1, Q2, and Q3 at the 25th, 50th, and 75th percentiles, respectively. Deciles split data into ten parts, while percentiles break it down into 100 equal sections, indicating the position of a data point. To find percentiles, you can use the formula K/(100*n+1) for their location.

Transcript

in this video we're going to talk about quartiles deciles and percentiles so what are they exactly quartiles divides the data into four equal parts what I like to think about is quarters four quarters adds up to one dollar now let's draw a number line and we're going to go from zero to a hundred but let's divide the number line into four equal part... Read More

Key Insights

  • 🥳 Quartiles divide data into four equal parts (Q1, Q2, Q3 representing 25th, 50th, and 75th percentiles).
  • 🥳 Deciles divide data into ten equal parts (D1-D10 representing 10th, 20th, 30th, ..., 90th percentiles).
  • 🥳 Percentiles divide data into 100 equal parts, indicating the relative position of a data point within the data set.
  • 📌 The formula K/(100*n+1) can be used to find the location of a percentile value.
  • 🚰 Cumulative relative frequency tables can be created to calculate percentile values.

Install to Summarize YouTube Videos and Get Transcripts

Explore YouTube Video Summarizer or Get YouTube Transcript Extractor

Questions & Answers

Q: What do quartiles represent?

Quartiles represent the values that divide data into four equal parts, with Q1, Q2, and Q3 indicating the 25th, 50th, and 75th percentiles respectively.

Q: How are deciles different from quartiles and percentiles?

Deciles divide data into ten equal parts, representing the 10th, 20th, 30th, ..., 90th percentiles. They are different from quartiles and percentiles in the number of divisions.

Q: What does it mean if a data point falls in the 70th percentile?

A data point in the 70th percentile means that 70% of the data is less than or equal to that data point, while 30% is greater than or equal to it.

Q: How can quartiles, deciles, and percentiles be calculated using a list of numbers?

Quartiles can be found by identifying the median of the entire data set (Q2), the median of the lower half (Q1), and the median of the upper half (Q3). The same process applies to deciles and percentiles.

Summary & Key Takeaways

  • Quartiles divide data into four equal parts, with Q1, Q2, and Q3 representing the 25th, 50th, and 75th percentiles respectively.

  • Deciles divide data into ten equal parts, with D1-D10 representing the 10th, 20th, 30th, ..., 90th percentiles respectively.

  • Percentiles divide data into 100 equal parts, with the nth percentile indicating how many values are less than or equal to a certain value.


Read in Other Languages (beta)

English

Share This Summary 📚

Summarize YouTube Videos and Get Video Transcripts with 1-Click

Download browser extensions on:

Try YouTube Summary with ChatGPT & Claude or YouTube Transcript Generator

Explore More Summaries from The Organic Chemistry Tutor 📚

How to Simplify Trigonometric Expressions Using Power Reducing Formulas thumbnail
How to Simplify Trigonometric Expressions Using Power Reducing Formulas
The Organic Chemistry Tutor
What Resources Are Available for Organic Chemistry on Patreon? thumbnail
What Resources Are Available for Organic Chemistry on Patreon?
The Organic Chemistry Tutor
What Are the Essential Differentiation Formulas in Calculus? thumbnail
What Are the Essential Differentiation Formulas in Calculus?
The Organic Chemistry Tutor
The Power Rule For Derivatives thumbnail
The Power Rule For Derivatives
The Organic Chemistry Tutor
How to Draw the Lewis Structure of Nitric Acid (HNO3) thumbnail
How to Draw the Lewis Structure of Nitric Acid (HNO3)
The Organic Chemistry Tutor
How To Find The Cube Root of a Large Number thumbnail
How To Find The Cube Root of a Large Number
The Organic Chemistry Tutor

Summarize YouTube Videos and Get Video Transcripts with 1-Click

Download browser extensions on:

Try YouTube Summary with ChatGPT & Claude or YouTube Transcript Generator

Apps & Extensions

  • Chrome Extension
  • Safari Extension
  • Edge Add-ons
  • Firefox Add-ons
  • iOS App
  • Android App

Key Features

  • YouTube Video Summarizer
  • Web & PDF Summarizer
  • Web & PDF Highlighter
  • Chat with PDF
  • Ask AI Clone
  • Audio Transcriber
  • Glasp Reader
  • Kindle Highlight Export
  • Idea Hatch

Integrations

  • Obsidian Plugin
  • Notion Integration
  • Pocket Integration
  • Instapaper Integration
  • Medium Integration
  • Readwise Integration
  • Snipd Integration
  • Hypothesis Integration

More Features

  • APIs
  • MCP Connector
  • Blog & Post
  • Embed Links
  • Image Highlight
  • Personality Test
  • Quote Shots

Company

  • About us
  • Our Story
  • Blog
  • Community
  • FAQs
  • Job Board
  • Newsletter
  • Pricing
Terms

•

Privacy

•

Guidelines

© 2026 Glasp Inc. All rights reserved.