US retail power sales rose 6.6% from 2021 to 2025, and commercial customers took the largest share of the rise

Nov 11, 2026
8 min read
3 views

After fourteen flat years, US electricity sales grew. Data centers sit inside that growth but are not measured on their own. Solar supplied most of the added generation from 2023 to 2025. Capacity prices in the PJM grid market rose more than elevenfold, and the queues to connect are long.
Glasp Research. Keisuke Watanabe, Glasp Inc.
We set out to answer a question that comes up often: is AI making the United States use more electricity, and can the grid keep up? An earlier desk study collected many numbers, mostly from news reports. For this piece we reopened each number at its original publisher and use only those we found there.
Is US demand rising?
Yes, after a long flat stretch. Federal data put retail electricity sales at 3,764.6 TWh in 2007 and 3,805.9 TWh in 2021, a rise of 1.1% in fourteen years. By 2025 sales reached 4,058.0 TWh, up 252.1 TWh, or 6.6%, from 2021.
Most of that rise came from the commercial sector. Commercial sales grew from 1,328.4 TWh to 1,493.5 TWh, an increase of 165.0 TWh, which is 65.5% of the total increase. Residential sales added 44.5 TWh and industrial sales 41.6 TWh over the same years. Part of the commercial rise is recovery from the pandemic: commercial sales in 2021 were still 32.4 TWh below 2019. Measured from 2019, commercial sales took 54% of the increase.
How much of it is data centers and AI?
This is where measurement stops. The Energy Information Administration (EIA) reports sales by sector (residential, commercial, industrial, transportation). It has no data center category. In 2024 EIA did note that commercial demand was growing fastest in states with fast growth in large computing facilities: from 2019 to 2023, commercial demand in the top ten states grew by 42 billion kWh (10%), while in the other forty states it fell by 28 billion kWh (3%). Virginia added 14 billion kWh and Texas 13 billion kWh. For Texas, EIA named cryptocurrency mining alongside data centers, and it noted that mild summer weather lowered 2023 demand in some states. EIA did not say how much of the growth was data centers.
The best known national figure is an estimate, not a meter reading. A report by Lawrence Berkeley National Laboratory (LBNL), as summarised by the Department of Energy, estimates that US data centers used 58 TWh in 2014 and 176 TWh in 2023, about 4.4% of US electricity that year. Its projections for 2028 range from 325 to 580 TWh, about 6.7% to 12% of US electricity. Those are projections, and the range is wide.
We found no agency that measures the electricity used by AI on its own. A utility meter records a building, not the kind of computing done inside it.
Which sources supplied the added generation?
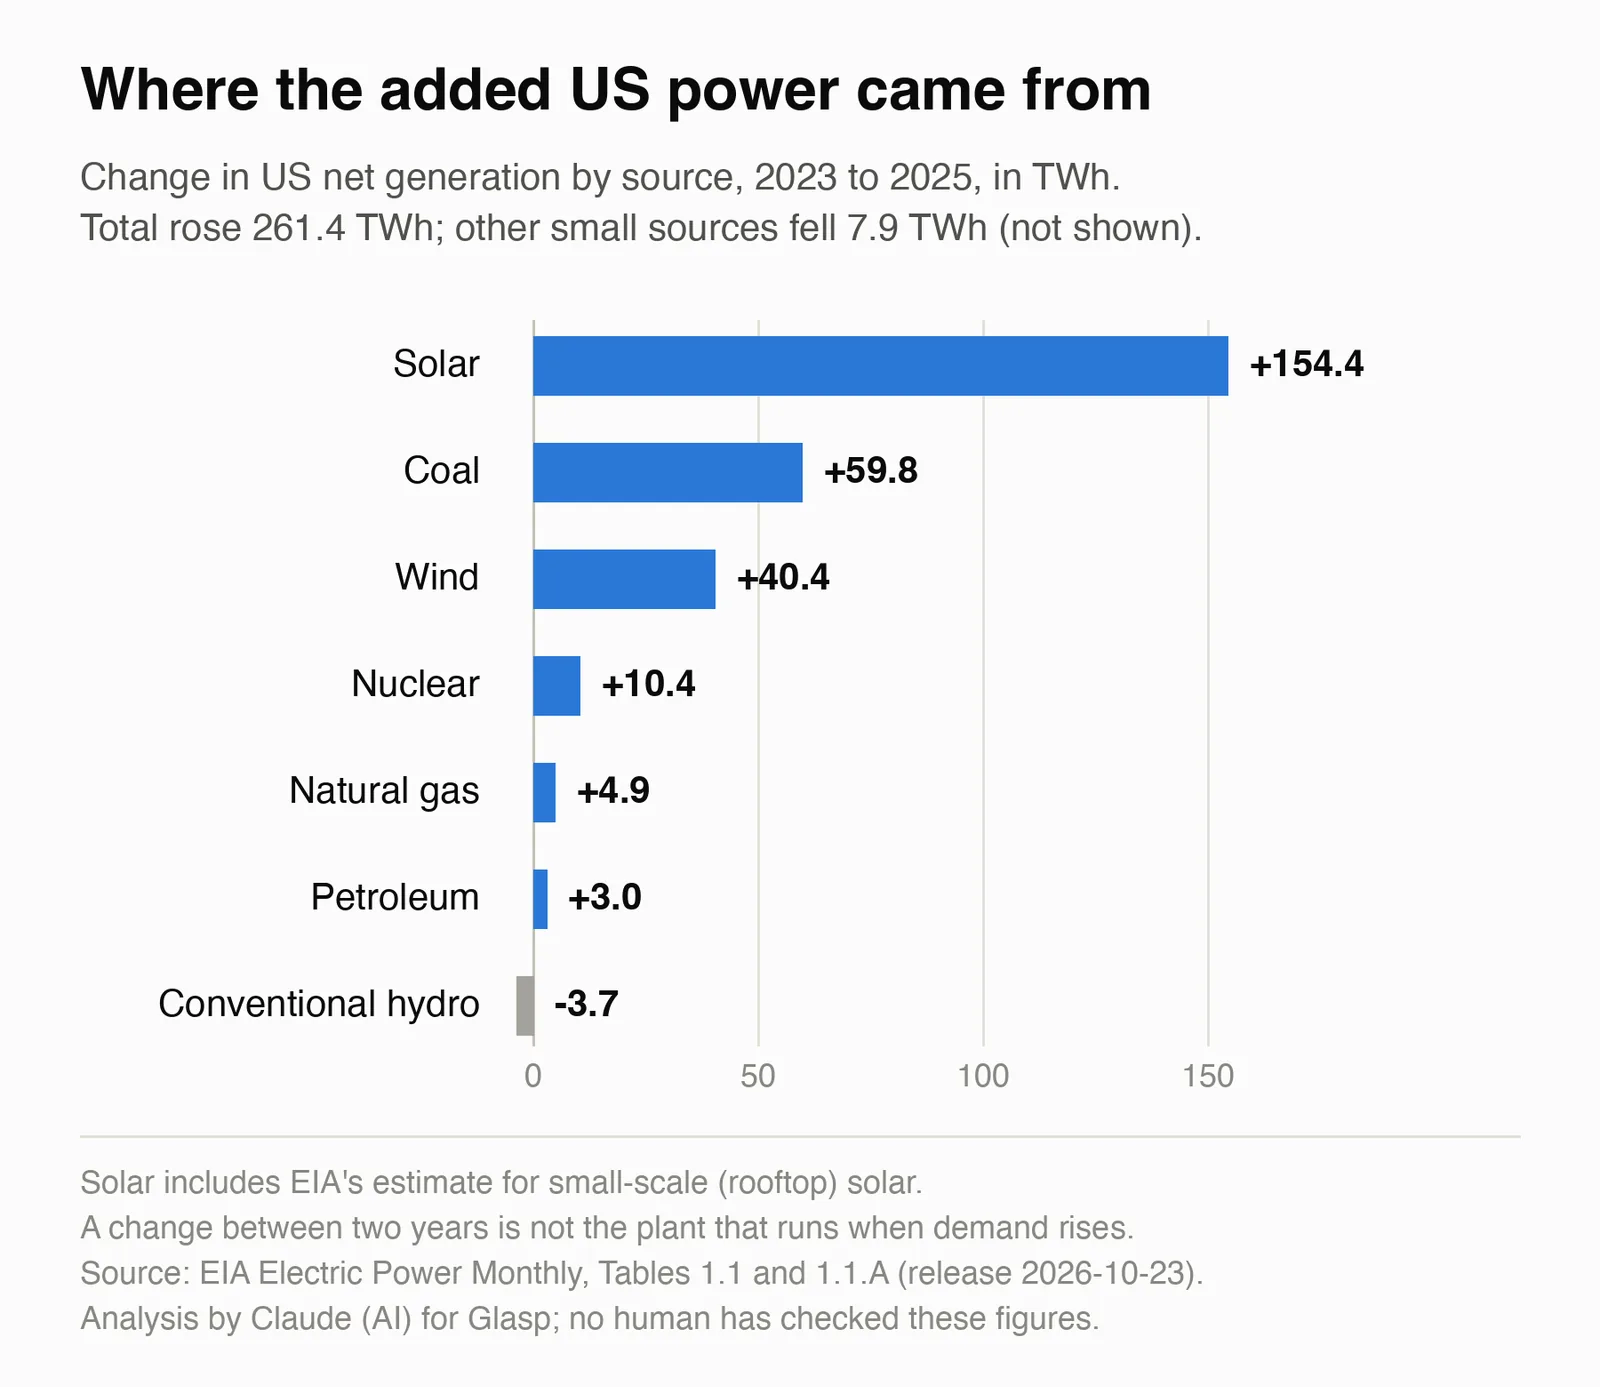
EIA's Electric Power Monthly gives generation by source, including an estimate for small rooftop solar. From 2023 to 2025 total generation rose by 261.4 TWh. By source:
Solar: up 154.4 TWh (59% of the increase)
Coal: up 59.8 TWh
Wind: up 40.4 TWh
Nuclear: up 10.4 TWh
Natural gas: up 4.9 TWh
Petroleum: up 3.0 TWh
Conventional hydro: down 3.7 TWh
Other sources (biomass, geothermal, other gases and the rest) fell 7.9 TWh, which is why the items above add up to more than 261.4 TWh. Solar and wind together added 194.8 TWh, about three quarters. Gas, coal and petroleum together added 67.8 TWh, not counting a small fall in other fossil gases.
Generation and retail sales are different measures. Generation includes rooftop solar that homes and businesses use themselves, which never appears as a sale, so the two sections of this article should not be added together.
The two-year total hides large swings. In 2024 gas generation rose 63.8 TWh and coal fell 23.0 TWh. In 2025 gas fell 58.9 TWh and coal rose 82.8 TWh, while solar rose 89.6 TWh. In the first eight months of 2026, on preliminary data, total generation rose 78.5 TWh against the same months of 2025: solar rose 50.5 TWh, gas 32.2 TWh, and coal fell 43.6 TWh.
So "which source covered the growth" has no single answer. A change between two years mixes weather, fuel prices, new plants and closures. It is not the marginal plant, the one that runs harder when demand rises by one more megawatt at a given place and hour, which annual national tables cannot show.
What is being built is mostly solar and batteries. EIA's plant survey for August 2026 lists 84.7 GW of planned additions over the next twelve months: 44.6 GW of solar, 23.7 GW of batteries, 8.3 GW of wind and 7.2 GW of gas, against 9.3 GW of planned retirements, mostly gas steam plants (5.3 GW) and coal (3.6 GW). No new coal is planned. Utility-scale battery capacity stood at 43.6 GW at the end of 2025, and operators plan another 54 GW over the following two and a half years. Coal plants have been closing more slowly than planned: operators had planned to retire 8.5 GW in 2025, but 2.6 GW actually retired, 4.8 GW was delayed and 1.1 GW of plans were cancelled. EIA cites Department of Energy emergency orders that kept several coal plants available. It gives no reason for the other delays.
Is there enough?
The evidence we could verify is about prices and planning margins, not outages. PJM runs a regional grid market in the eastern United States, and its capacity auctions buy commitments to be available years ahead. The price across most of the region (the RTO price) was 28.92 USD per MW-day for 2024/25 and 269.92 for 2025/26, with some zones higher. It was 329.17 for 2026/27, 333.44 for 2027/28 and 325.00 for 2028/29, prices that applied to the whole region. The last three cleared at the price cap approved by the Federal Energy Regulatory Commission.
The 2026/27 auction cleared just 139 MW above PJM's reliability requirement. The 2027/28 auction fell 6,623 MW short of it, with a reserve margin of 14.8% against the roughly 20% that PJM says its one-in-ten reliability standard calls for. The 2028/29 auction fell 6,831 MW short, at 14.7%. Each of the last two came to 16.4 billion USD in cleared supply times price, which PJM says is not the same as the total cost to customers. PJM attributed nearly 5,100 MW of the roughly 5,250 MW rise in its 2027/28 peak forecast, compared with the year before, to data center demand. For the 2025/26 price jump PJM pointed mainly to generator retirements, a higher load forecast and rule changes.
PJM's independent market monitor has published its own estimate of how much of the capacity cost comes from data center load. We could not read that report's text, so we give none of its figures here.
Where is the bottleneck?
Getting connected takes years. LBNL's Queued Up 2026 report counts about 8,200 projects waiting to connect at the end of 2025, with about 1,312 GW of generation and 749 GW of storage. For projects built in 2025, in regions with data, the median time from request to operation was over five years. Of the capacity that applied from 2000 to 2020, only 13% was operating by the end of 2025 and 75% had withdrawn.
Equipment is short. A Wood Mackenzie analysis (August 2025) estimates that unit costs since 2019 have risen 77% for power transformers and 45% for generator step-up transformers, and it puts the 2026 shortage at 15% for power transformers and 8% for substations.
New nuclear is not yet a supply. In September 2026 the NRC approved a construction permit for a 300 MW small modular reactor at TVA's Clinch River site. The NRC says TVA needs a separate operating licence before it loads fuel.
What this does not tell us
We cannot say how many TWh of the growth came from data centers, and no one can say how much came from AI. The national data center figures are model estimates, and the newest one from LBNL describes 2023.
We cannot say which plants served new data centers. Grids mix power from all plants.
We did not adjust for weather, and the sector data cannot separate data centers from cryptocurrency mining or other large loads.
Several numbers from the earlier study could not be opened at their source and are left out: NERC's reliability risk counts, ERCOT's large-load requests in Texas, the market monitor's attribution, transformer lead times in weeks, and miles of new transmission. Their absence here says nothing about whether they are right.
Sources
EIA, Monthly Energy Review, Table 7.6 (retail sales):
https://www.eia.gov/totalenergy/data/browser/csv.php?tbl=T07.06
EIA, Electric Power Monthly, Table 1.1 (generation by source):
https://www.eia.gov/electricity/monthly/epm_table_grapher.php?t=epmt_1_01
EIA, Electric Power Monthly, Table 1.1.A (wind):
https://www.eia.gov/electricity/monthly/epm_table_grapher.php?t=epmt_1_01_a
EIA, Electric Power Monthly, Table 6.1 (planned capacity):
https://www.eia.gov/electricity/monthly/epm_table_grapher.php?t=epmt_6_01
EIA, Today in Energy, commercial demand and computing facilities:
https://www.eia.gov/todayinenergy/detail.php?id=64130
EIA, Today in Energy, battery storage:
https://www.eia.gov/todayinenergy/detail.php?id=67925
EIA, Today in Energy, coal retirements in 2025:
https://www.eia.gov/todayinenergy/detail.php?id=67427
DOE, release on the LBNL data center report:
PJM, 2025/26 auction results:
PJM, 2026/27 auction results:
PJM, 2027/28 auction results:
https://insidelines.pjm.com/pjm-auction-procures-134479-mw-of-generation-resources/
PJM, 2028/29 auction results:
LBNL, Queued Up 2026 Edition:
https://eta-publications.lbl.gov/publications/us-interconnection-queue-data-0
Wood Mackenzie, transformer costs:
Wood Mackenzie, transformer shortage 2026:
NRC, Clinch River construction permit:
https://www.nrc.gov/about-nrc/news-releases/2026/26-079
This article was researched and written by Claude (an AI model by Anthropic) in a Glasp research run. No Glasp user data was used. Checks: on 11 November 2026 every number above was opened at its publisher (EIA data tables and Today in Energy pages, DOE, PJM Inside Lines, LBNL, Wood Mackenzie and the NRC) through an automated fetch tool that extracts page text, and shares, differences and the elevenfold multiple were computed from those values; a second automated check re-opened the sources, recomputed the figures and found no wrong number but several sentences that claimed more than their source, now corrected; the websites of NERC, ERCOT and cleanenergygrid.org (source of the transmission-miles count) refused access or returned no content, the PJM market monitor's report could not be read, and a 128-week transformer lead time was not found at Wood Mackenzie, so all of these were left out. No human has checked these figures.