Japan's 2026 Fire Horse year: birth-statistics forms exceeded a simple trend extrapolation

Oct 31, 2026
13 min read
2 views
A short research note comparing January to August 2026 preliminary vital statistics with the extrapolation of a log-linear trend model fitted to 2015 to 2025 (a comparison chosen after the direction of the result was known)
2026 is a hinoeuma (丙午), or "Fire Horse", year; the previous one was 1966, sixty years earlier. A superstition holds that women born in a Fire Horse year are hot-tempered (Yoshikawa 2026). In 1966, the number of births in Japan fell 25% from the year before (from 1,823,697 to 1,360,974). How did the count move this time?
Data and method
The main source is the monthly birth count in the Ministry of Health, Labour and Welfare (MHLW) Vital Statistics Rapid Report (人口動態統計速報; the English titles of the MHLW reports in this note are our translations). This report counts the statistical forms made from birth registrations ("birth-statistics forms"), by the month in which the form was made, not by the month of birth. It also includes foreign nationals in Japan, Japanese nationals abroad, and births that occurred in earlier years. The number of birth-statistics forms made in January to August 2026 was 464,110, almost the same as in the same period a year earlier (464,517).
A comparison with the previous year alone does not show the long decline. A simple model was therefore fitted to the 132 months of 2015 to 2025: the logarithm of forms per day in each month, explained by month effects and a straight line in time. The model was then used to predict January to August 2026. The slope of this model is about -4% per year (the average slope of the line, not the actual rate of decline in each year). The same procedure was applied to each year from 2019 to 2025, using only data up to the previous year ("placebo years"), to see how far the extrapolation is off in years with no Fire Horse.
The formula and the rules for reading the result were set out in an internal analysis plan written before the main estimate was computed with the 2026 values (dated in private version control, not publicly registered). That timing is self-reported: the plan is not public, so a third party cannot confirm it. Before the plan was written, the preliminary figure of "about the same as last year" had already been seen, so the direction of the result could be anticipated. This topic was also moved up after a different topic met its stopping condition. Read this, then, not as a pre-registration but as a comparison chosen after the direction of the result was known.
Results
Birth-statistics forms for January to August 2026 were 3.4% above the model's extrapolation (448,688 forms). This is the deviation that can be computed directly. In the 7 placebo years, on the other hand, this model's extrapolation was always above the actual count: the forecast errors (actual relative to extrapolation; negative means the actual count was below the extrapolation) ranged from -3.0% to -0.4%, with a mean of -1.7%. In the calculation that our internal plan specified beforehand, the central value was the difference from the mean of these 7 past forecast errors (+5.3%). There is no guarantee, however, that the mean of past forecast errors also applies to 2026, so this note presents +3.4% as the main figure and gives +5.3% only alongside it. Both are deviations from this simple model, not deviations from the natural course of births.
Among the 8 forecast errors side by side (7 placebo years and 2026), 2026 was the highest. With only 8 values, however, and with placebo years whose fitting periods overlap and differ in length, this ranking is a description only, not a test that rules out chance. An interval calculated on the assumption that the errors independently follow the same normal distribution is given in the appendix, but it cannot be used as an interval of statistical uncertainty.
Changing the comparison did not change the direction. Without subtracting past forecast errors the figure is +3.4%; subtracting the most upward placebo error (-0.4%) gives +3.9%. As checks added at the stage of looking at the results, fitting the model only from 2018 onward gives +4.7% (difference from the mean of past forecast errors +5.3%), and leaving 2020 and 2021 out of the fitting period gives +3.8% (same difference +6.0%) (procedures in the appendix). Adding the previous year's annual Rapid Report marriage count (marriage-statistics forms) to the model shrinks the deviation to +2.2%. This is an exploratory fit of 3 coefficients to 11 points; it does not mean that marriages explained the excess, nor that it adjusts for any Fire Horse effect. Note also that MHLW states that the 2016 monthly Rapid Report values from March onward may differ from actual figures because of delays in the arrival of forms caused by the Kumamoto earthquake. The check fitted only from 2018 onward does not use 2016, and the direction was the same.
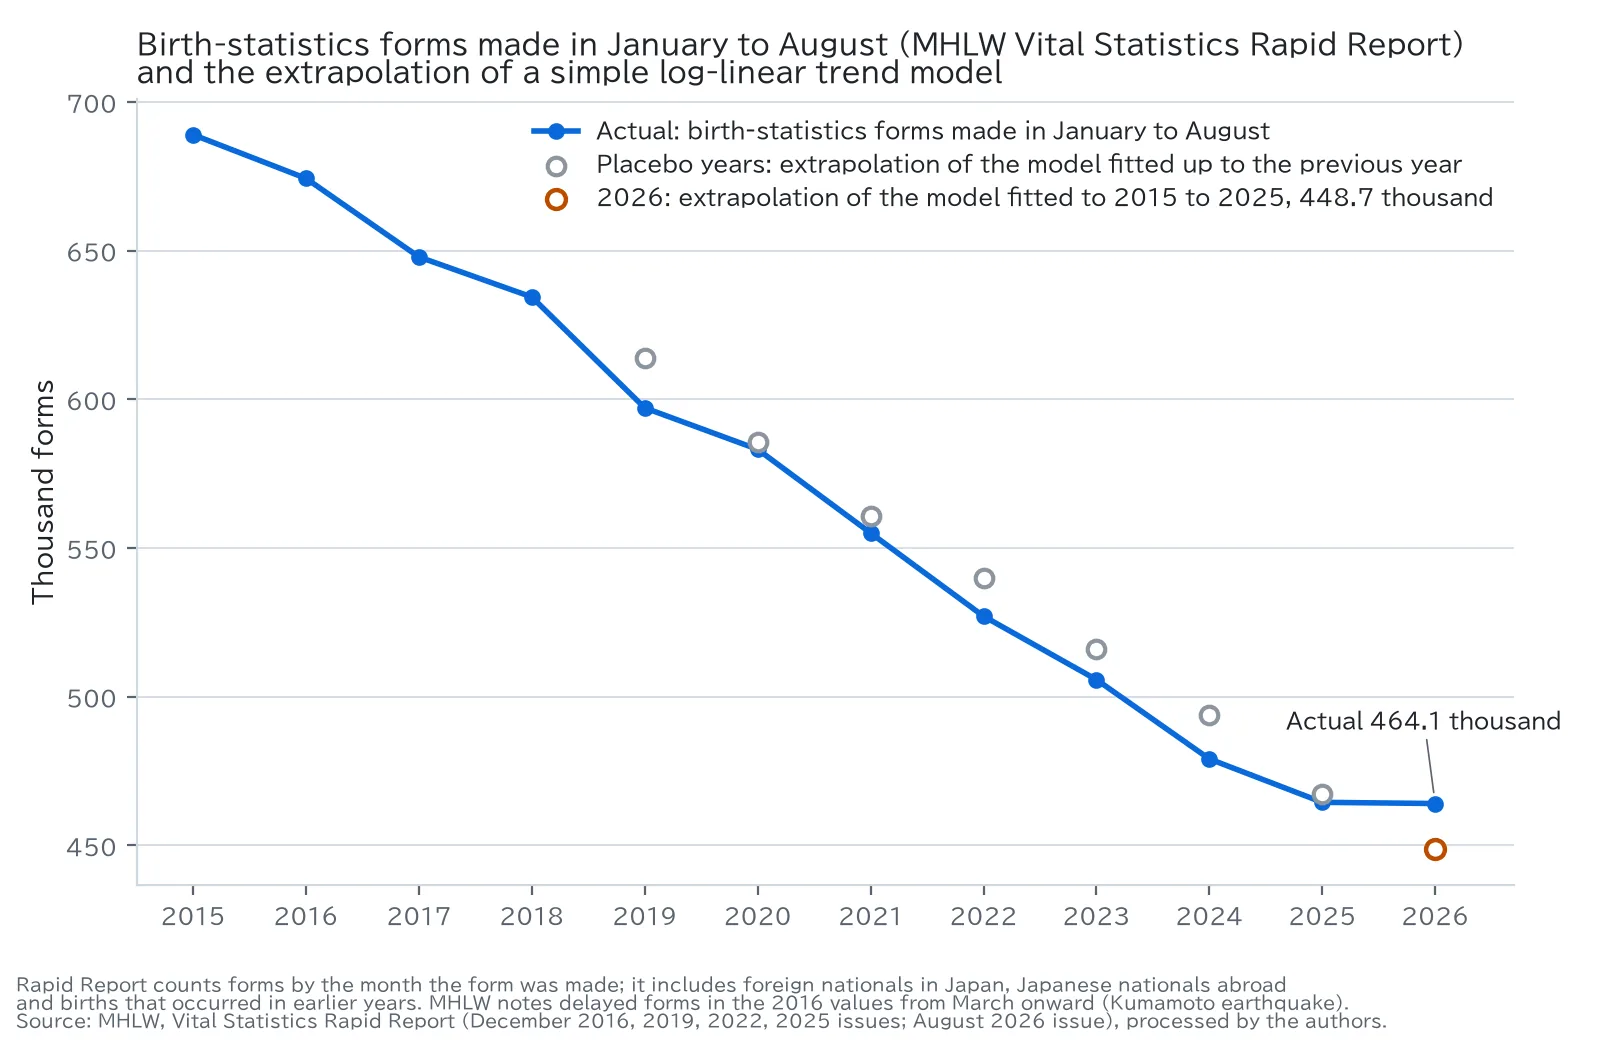
Figure: cumulative birth-statistics forms made in January to August (blue), and the extrapolation of a simple log-linear model fitted to data up to the previous year (open circles; grey for placebo years, orange for 2026).
As a supporting check, statistics on Japanese nationals only (the Vital Statistics Monthly Report, provisional figures (人口動態統計月報(概数)), counted by month of birth; at present only January to May are published) were also 3.7% above the extrapolation of an annual log-linear model, and the difference from the mean of past forecast errors was +5.8%, in the same direction. The people and period covered overlap with the main analysis, so this is not an independent replication. The two statistics also differ not only in nationality but in the month counted and in the handling of late registrations, so this agreement does not separate out the contribution of births to foreign nationals.
In 1966, the sex ratio at birth (boys per 100 girls) was 107.6, about 1.9 above the mean of the previous 11 years (105.7). One study has suggested that some girls' years of birth were registered as the year before or after (Grech 2016). The sex ratio alone, however, cannot distinguish manipulation of the registered year from avoidance of pregnancy, abortion and the like. For January to May 2026 (Japanese nationals) the ratio was 105.36; against the same kind of baseline (the mean for January to May of the previous 11 years, 105.35) the difference was +0.01 (approximate 95% interval -0.81 to +0.82, combining a binomial approximation with the year-to-year variation of the past 11 years). In the January to May data, no rise as large as the full-year rise in 1966 is visible.
What this note does not say
It does not say "the Fire Horse had no effect". What was measured is the net deviation from a 2015 to 2025 trend model, not an estimate of what 2026 would have been without the Fire Horse. Even if some people postponed having a child, the effect would not be visible if offset by forces raising births for other reasons, such as a recovery in marriages. What can be said is only "compared with this model, the count did not fall short".
It does not identify the cause of the excess.
Shifts across the year boundary, such as moving births at the end of 2026 into 2027 or bringing them forward to the end of 2025, and moving registrations between the end and start of a year, cannot be judged from January to August counts. Clues will come from the 2026 annual total of the monthly reports for Japanese nationals in Japan (月報年計, around June 2027) and the final figures (確定数, around September 2027). These differ from the Rapid Report in who is counted and which month is used, so they do not connect directly to the numbers in this note.
The sex ratio comparison covers January to May only. The 1966 value is for the whole year, and shifted registrations are thought likely to cluster around the end and start of a year, so it cannot be said that nothing like 1966 happened.
The comparison also has limited sensitivity. Even under the unchecked assumptions of independence, normality and stationarity, if θ (the 2026 deviation minus the mean of the placebo-year forecast errors) were truly a 2% shortfall, the probability that this calculation would detect it is about 50%. This is not the probability of detecting a Fire Horse effect.
Studies also differ on what happened in 1966. Kaku (1975) estimated that births were about 463,000 fewer than expected from a trend fitted to the surrounding years, and reported that induced abortions were more numerous than expected. Hayashi (National Institute of Population and Social Security Research) attributes one third of the decline to abortion and states that, because births rose in the years before and after, the decline over the 3 years combined was only 4%. Yoshikawa (2026) states that births were brought forward and postponed over several years around 1966, and that induced abortions did not increase in 1966 alone. Kaku's comparison is with values expected from a regression on the surrounding years, which is not the same quantity as the change in the national count itself that Yoshikawa refers to, so both can hold at once. One study separately estimated sex-blind avoidance, sex-selective avoidance and shifting into adjacent years for 1846, 1906 and 1966 (Rohlfs et al. 2010). Because the counting methods and baselines differ, this note does not choose among them.
Disclosure
The text of this note was drafted with AI assistance (Anthropic Claude) and checked against the cited sources and the replication files; the numbers were recomputed from the published statistical tables. The note was reviewed by an AI reviewer (OpenAI Codex). Only official public statistics and published literature were used; no Glasp user data was used. There was no external funding, and there are no known conflicts of interest.
Replication files (code and data): deposited with this note.
https://doi.org/10.5281/zenodo.23838815
Sources
All retrieved on 2026-10-26 (Hayashi and Yoshikawa on 2026-10-24; MHLW annual series on 2026-10-31). MHLW statistics are used under the Public Data License (公共データ利用規約) Version 1.0, processed and compiled by Glasp Research.
MHLW, Vital Statistics Rapid Report (人口動態統計速報), chart data. December 2016 issue (monthly figures for 2014 to 2016), December 2019 issue (2017 to 2019), December 2022 issue (2020 to 2022), December 2025 issue (2023 to 2025), August 2026 issue (2026; a note in the PDF states that counts are the number of forms made). The December 2016 PDF carries the note on delayed forms in the 2016 values from March onward due to the Kumamoto earthquake.
https://www.mhlw.go.jp/toukei/saikin/hw/jinkou/geppo/s2016/12.html
https://www.mhlw.go.jp/toukei/saikin/hw/jinkou/geppo/s2019/12.html
https://www.mhlw.go.jp/toukei/saikin/hw/jinkou/geppo/s2022/12.html
https://www.mhlw.go.jp/toukei/saikin/hw/jinkou/geppo/s2025/12.html
https://www.mhlw.go.jp/toukei/saikin/hw/jinkou/geppo/s2026/08.html
https://www.mhlw.go.jp/toukei/saikin/hw/jinkou/geppo/s2026/dl/202608.pdf
https://www.mhlw.go.jp/toukei/saikin/hw/jinkou/geppo/s2016/dl/201612.pdf
MHLW, Vital Statistics Rapid Report, December 2025 issue, annual series table (2014 annual marriage-statistics forms, 658,579 couples, matching the sum of the 2014 monthly chart data).
https://www.mhlw.go.jp/toukei/saikin/hw/jinkou/geppo/s2025/dl/202512h.pdf
MHLW, Vital Statistics Monthly Report, provisional figures (人口動態統計月報(概数)), May issue of each year 2015 to 2026, statistical table 3 (2-2), all Japan, January to May cumulative.
https://www.mhlw.go.jp/toukei/saikin/hw/jinkou/geppo/m2015/dl/all2705.pdf
https://www.mhlw.go.jp/toukei/saikin/hw/jinkou/geppo/m2016/dl/all2805.pdf
https://www.mhlw.go.jp/toukei/saikin/hw/jinkou/geppo/m2017/dl/all2905.pdf
https://www.mhlw.go.jp/toukei/saikin/hw/jinkou/geppo/m2018/dl/all3005.pdf
https://www.mhlw.go.jp/toukei/saikin/hw/jinkou/geppo/m2019/dl/all0105.pdf
https://www.mhlw.go.jp/toukei/saikin/hw/jinkou/geppo/m2020/dl/all0205.pdf
https://www.mhlw.go.jp/toukei/saikin/hw/jinkou/geppo/m2021/dl/all0305.pdf
https://www.mhlw.go.jp/toukei/saikin/hw/jinkou/geppo/m2022/dl/all0405.pdf
https://www.mhlw.go.jp/toukei/saikin/hw/jinkou/geppo/m2023/dl/all0505.pdf
https://www.mhlw.go.jp/toukei/saikin/hw/jinkou/geppo/m2024/dl/all0605.pdf
https://www.mhlw.go.jp/toukei/saikin/hw/jinkou/geppo/m2025/dl/toukeihyo_05.pdf
https://www.mhlw.go.jp/toukei/saikin/hw/jinkou/geppo/m2026/dl/toukeihyo_05.pdf
National Institute of Population and Social Security Research, Population Statistics 2025 (人口統計資料集 2025), Table 4-1, Births by sex and sex ratio at birth (original source MHLW Vital Statistics; Okinawa Prefecture not included before 1972).
https://www.ipss.go.jp/syoushika/tohkei/Data/Popular2025/T04-01.htm
MHLW, "Bridge coding methods (draft)" (ブリッジコーディングの技法(案)), material 2 for the 2nd meeting of the working group on applying an ICD-11-based statistical classification to vital statistics (2026-02-09), page 2 (target dates: annual total of the monthly reports June 2027, final figures September 2027; coverage is Japanese nationals in Japan).
Hayashi Reiko, "Toward the 2026 hinoeuma: trends and outlook" (2026年の丙午(ひのえうま)に向けて-推移と展望), sub-project report under a Health, Labour and Welfare Sciences Research Grant (project number 202401013A; only the 2-page summary was checked; English title is our translation).
https://mhlw-grants.niph.go.jp/system/files/report_pdf/202401013A-buntan1_1.pdf
Yoshikawa Toru, "Reading the 'hinoeuma superstition' scientifically from data" (「ひのえうま迷信」をデータから科学的に読み解く), JST Science Portal, 2026-01-07 (English title is our translation).
Kaku K (1975). Increased induced abortion rate in 1966, an aspect of a Japanese folk superstition. Annals of Human Biology 2(2): 111-115 (abstract only checked).
Grech V (2016). The Japanese male: Female birth ratio rose in the 1966 Fire-Horse year due to female birth year misrepresentation. Early Human Development 103: 133-135 (abstract only checked).
Rohlfs C, Reed A, Yamada H (2010). Causal effects of sex preference on sex-blind and sex-selective child avoidance and substitution across birth years: Evidence from the Japanese year of the fire horse. Journal of Development Economics 92(1): 82-95 (abstract only checked).
Appendix: data and method to reproduce the main numbers
The principal numerical results of this analysis can be recomputed from the tables in this appendix; the literature figures (Kaku, Hayashi, Yoshikawa, Rohlfs et al.) come from the cited sources. The replication files run the same calculations.
Data 1 (main analysis). Monthly birth-statistics forms in the Rapid Report (by month the form was made). Each year's values are taken from the chart data of the most recent December issue that includes that year (for 2026, the August issue). The rightmost column is the annual total of marriage-statistics forms in the Rapid Report (couples; counted, like births, as forms made); for 2014 it is 658,579 (chart data of the December 2016 issue; the same figure appears in the annual series table of the December 2025 issue).
Year,Jan,Feb,Mar,Apr,May,Jun,Jul,Aug,Sep,Oct,Nov,Dec,"Marriage-statistics forms, annual total"
2015,87885,78828,85103,85193,86005,85788,91410,88837,89134,88796,83806,86279,650519
2016,85296,80045,84025,81159,84786,83547,87033,88453,87772,86117,81038,81673,636522
2017,82411,74451,81222,77719,83804,79593,82963,85771,84412,84345,80218,81258,623010
2018,81866,71952,77146,76384,82700,78183,82830,83386,79280,82654,77462,76989,602735
2019,76519,67284,71704,71138,79694,73194,79057,78581,76629,77341,72757,74702,615652
2020,74672,66639,71135,73286,71940,73037,76785,75724,75843,74846,69494,69282,537583
2021,63742,59789,69446,70582,70439,71031,74263,75788,75489,73129,70396,68803,514242
2022,67542,59356,65313,63066,65190,64475,68096,74073,72525,70235,65701,64156,519823
2023,64052,56930,61495,60006,64594,63975,66522,68202,63880,64802,62428,61745,489281
2024,61074,54532,55198,59210,62060,58000,65231,63805,61057,63471,57939,59411,499999
2025,58385,50951,53619,57306,60718,58301,63415,61822,60547,63210,56981,60554,505656
2026,58694,50761,53844,59260,59663,59846,62479,59563,,,,,
Method. log(forms in the month / days in the month) = month fixed effects (12) + b × time (year + (month - 1) / 12), fitted by unweighted least squares from January 2015 to December of the previous year. The prediction is exp(predicted value) × days for each month, summed over January to August. Deviation (forecast error) D = log(actual / predicted). The placebo years 2019 to 2025 use the same procedure (each fitted up to December of the previous year). θ = D(2026) - mean of the placebo-year D. The reference interval (calculated assuming independence, normality and stationarity; not usable as an interval of uncertainty) is θ ± t(0.975, n - 1 degrees of freedom) × s × √(1 + 1/n), where n is the number of placebo years and s is the standard deviation of their D. Percentages are 100 × [exp(x) - 1].
Intermediate values. Main: 2026 extrapolation 448,688 forms (slope -0.0406 per year), D = +3.4%. Placebo-year D: 2019 -2.7%, 2020 -0.4%, 2021 -1.0%, 2022 -2.4%, 2023 -2.0%, 2024 -3.0%, 2025 -0.6% (mean -1.7%, s = 1.06% (log)). θ = +5.3%. The assumption-dependent reference interval (not usable as an interval of statistical uncertainty) is +2.4% to +8.2%. Japanese nationals only (Data 2): θ = +5.8%, reference interval under the same assumptions +2.3% to +9.5%.
Check fitted from 2018: the fitting period is restricted to January 2018 to December of the previous year (with the same restriction for all placebo years). Placebo-year D: 2021 +0.5% (prediction 552,494), 2022 -1.5% (535,186), 2023 -0.9% (510,332), 2024 -1.7% (487,502), 2025 +0.9% (460,353). 2026 prediction 443,311 forms, D = +4.7%, θ = +5.3%, reference interval (4 degrees of freedom) +1.6% to +9.1%.
Check leaving out 2020 and 2021: the 24 months of 2020 and 2021 are removed from the fitting period (likewise for placebo years). Placebo-year D: 2019 -2.7% (prediction 613,970), 2022 -3.2% (544,260), 2023 -1.6% (514,136), 2024 -2.5% (491,282), 2025 -0.1% (464,826). 2026 prediction 447,033 forms, D = +3.8%, θ = +6.0%, reference interval (4 degrees of freedom) +2.0% to +10.0%.
Exploratory model including marriages (not a decomposition of causes): log(January to August total) = a + b × year + c × log(previous year's annual Rapid Report marriage-statistics forms), fitted to 2015 to 2025, giving c = 0.20; against the 2026 prediction of 454,298 forms, +2.2%.
Probability of detection: under the same normality, independence and stationarity assumptions, the probability that a one-sided 5% test detects θ when it is negative (not the power to detect a Fire Horse effect). With 400,000 random draws (seed 1): 47% for a 2% decrease, 80% for 3.16%, 93% for 4%. This agrees with an analytical calculation from the noncentral t distribution (6 degrees of freedom).
Data 2 (Japanese nationals only, sex ratio). January to May cumulative totals (persons, by month of birth) from the May issue of the Monthly Report (provisional figures) for each year. The model log(January to May total) = a + b × year is fitted from 2015 to the previous year; placebo years, θ and the interval are as in the main analysis. The sex ratio interval combines the 2026 binomial standard error (ratio × √(1/boys + 1/girls)) with the standard error of the baseline mean (between-year standard deviation 0.24 / √11).
Year,Total,Boys,Girls
2015,405492,208327,197165
2016,396934,203595,193339
2017,382042,195677,186365
2018,372282,190989,181293
2019,348412,178626,169786
2020,341340,175107,166233
2021,317991,163146,154845
2022,304948,156412,148536
2023,290862,149075,141787
2024,274685,140918,133767
2025,263421,135463,127958
2026,263635,135258,128377
Data 3 (1966). Births by sex (persons) from Population Statistics 2025, Table 4-1. The mean sex ratio for 1955 to 1965 is 105.73; 1966 is 107.62 (boys 705,463, girls 655,511), a difference of +1.89. 1965 and 1967 are both 105.29 (+2.33 against a baseline of the two adjacent years). From 1955 in order, boys / girls: 889,670 / 841,022, 856,084 / 809,194, 805,220 / 761,493, 848,733 / 804,736, 835,822 / 790,266, 824,761 / 781,280, 817,599 / 771,773, 833,269 / 785,347, 852,561 / 806,960, 882,924 / 833,837, 935,366 / 888,331 (1965). 1967 is 992,778 / 942,869.