What Are the Heating and Cooling Curves of Water?
TL;DR
The heating curve of water illustrates how temperature changes with added heat energy, showing gradual increases until phase changes at 0°C and 100°C. Conversely, the cooling curve exhibits exothermic processes where energy is released during phase transitions, affecting potential and kinetic energy. The specific heat capacity of water influences how quickly its temperature changes in both curves.
Transcript
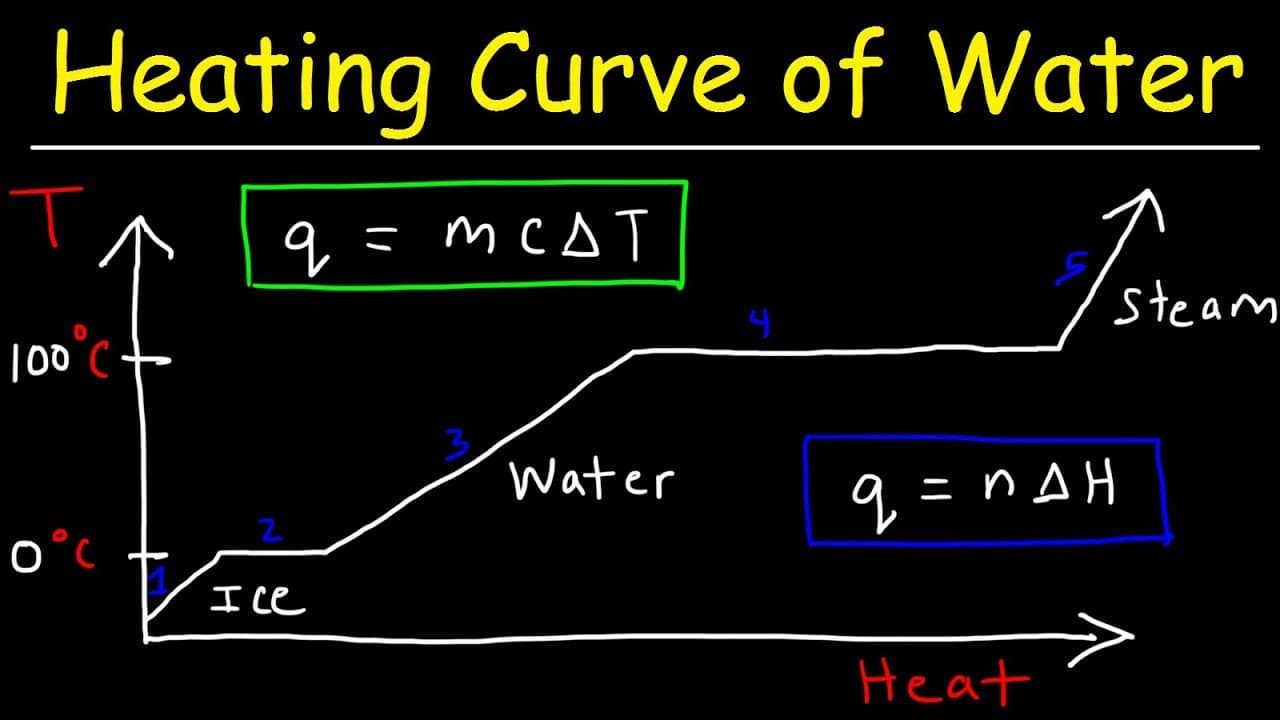
in this video we're going to talk about the heating curve and the cooling curve of water but let's start with the heating curve so on the y-axis this is going to be the temperature in celsius and on the x-axis the total amount of heat energy added which is going to be q with the units joules so let's say this is the freezing point of water which is... Read More
Key Insights
- 💱 The heating curve shows gradual temperature changes, phase changes, and the role of specific heat capacity in water.
- 😘 The specific heat capacity of water affects the slope of the curve, with a higher capacity resulting in a lower slope.
- 💱 Different equations are used to calculate heat energy for temperature changes and phase changes.
- 😎 The cooling curve is the reverse of the heating curve, representing an exothermic process.
- 💦 Energy is released during phase changes, as bonds are formed between water molecules.
- 💱 Temperature changes are associated with changes in kinetic energy, while phase changes are associated with changes in potential energy.
- 😎 The enthalpy of fusion and vaporization play significant roles in the heating and cooling curves.
Install to Summarize YouTube Videos and Get Transcripts
Explore YouTube Video Summarizer or Get YouTube Transcript Extractor
Questions & Answers
Q: How does the specific heat capacity of water affect the slope of the heating curve?
The specific heat capacity of water is high, which means it can absorb a lot of heat energy without a significant change in temperature. This results in a lower slope on the heating curve, indicating a slower increase in temperature compared to substances with lower specific heat capacities.
Q: What is the significance of segment two in the heating curve?
Segment two represents the phase change from ice to liquid water. During this phase change, no change in temperature occurs, as the energy added is used to break the hydrogen bonds between water molecules. This process requires a specific amount of heat energy, known as the enthalpy of fusion.
Q: How is the cooling curve different from the heating curve?
The cooling curve represents the process of cooling water. It starts with steam at a high temperature and gradually decreases to the freezing point. The phases and energy changes occur in reverse compared to the heating curve.
Q: What causes the release of energy in the cooling curve?
The release of energy in the cooling curve occurs during the phase changes from steam to liquid water and liquid water to ice. As the water molecules approach each other and form hydrogen bonds, energy is released into the surroundings.
Summary & Key Takeaways
-
The heating curve shows that as heat energy is added to ice, the temperature gradually increases until reaching the freezing point at 0 degrees Celsius. After a phase change, the temperature increases again until reaching the boiling point at 100 degrees Celsius.
-
The curve is divided into five segments, with different equations to calculate the heat energy for each segment, considering temperature changes or phase changes.
-
The slope of the curve is determined by the specific heat capacity of water, which affects how much heat energy is required to increase the temperature.
Read in Other Languages (beta)
Share This Summary 📚
Summarize YouTube Videos and Get Video Transcripts with 1-Click
Try YouTube Summary with ChatGPT & Claude or YouTube Transcript Generator
Explore More Summaries from The Organic Chemistry Tutor 📚


Summarize YouTube Videos and Get Video Transcripts with 1-Click
Try YouTube Summary with ChatGPT & Claude or YouTube Transcript Generator