How to Perform Linear Regression in R
TL;DR
To perform linear regression in R, use the LM function with your data frame and specify your formula. Interpret the outputs, including residuals, p-values, and R-squared values, to assess the model's effectiveness and the significance of predictors.
Transcript
I like stack West do you like stack ground I like stack West and I hope you like stack class - hello and welcome to stack West stack West is brought to you by the friendly folks in the genetics department at the University of North Carolina at Chapel Hill today we're going to be talking about doing linear regression in R this particular stack West ... Read More
Key Insights
- 😫 Linear regression in R requires importing the necessary data frame and using the LM function to set up the model.
- 💁 The summary function provides important information about the quality of the regression model, such as residuals, p-values, and R-squared values.
- 🆘 The interpretation of p-values helps determine the significance of the intercept and slope coefficients in the regression model.
- ❎ The R-squared value indicates the percentage of variation in the dependent variable that can be attributed to the independent variable in the model.
- 🫥 Adding the regression line to the graph allows visualizing the relationship between the variables in the linear regression model.
Install to Summarize YouTube Videos and Get Transcripts
Explore YouTube Video Summarizer or Get YouTube Transcript Extractor
Questions & Answers
Q: What is the purpose of this tutorial?
This tutorial aims to guide users on how to perform linear regression in R and understand the interpretation of the results. It assumes prior knowledge of data importing in R.
Q: How is the data frame for linear regression created in R?
The data for linear regression is created by using the data.frame() function, specifying the columns (e.g., weight and size). The resulting data frame can be printed using the variable name.
Q: How is the linear regression model set up in R?
The LM function (linear models) is used to set up the linear regression model. It takes a formula and the data frame as arguments, with the Y variable specified on the left and the X variable on the right of the tilde (~).
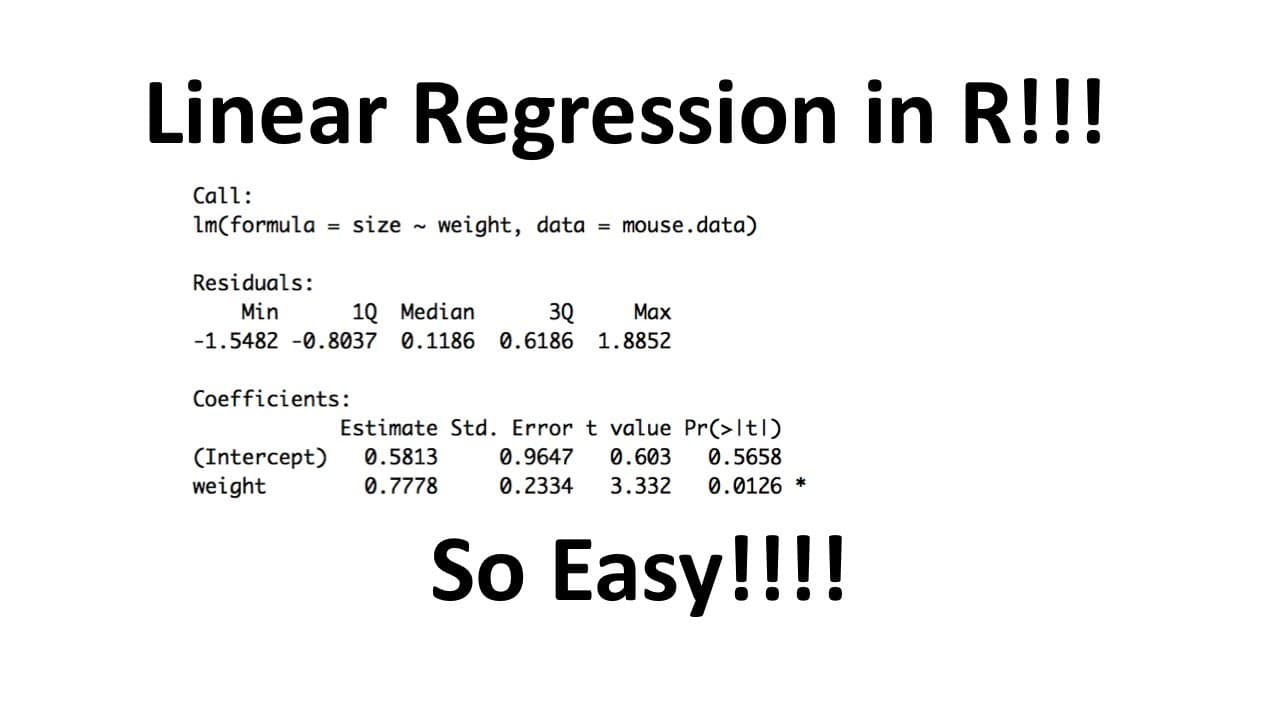
Q: What does the summary function in R provide for linear regression?
The summary function generates various outputs for linear regression. It includes information about residuals, least squares estimates for the fitted line, standard errors, t-values, p-values, residual standard error, R-squared values, and the significance of the R-squared.
Summary & Key Takeaways
-
The tutorial focuses on how to create a linear regression model in R using a pre-existing data frame.
-
It explains the process of setting up the linear regression using the LM function and specifying the formula.
-
The video demonstrates how to interpret various outputs, such as residuals, least squares estimates, p-values, and R-squared values.
Read in Other Languages (beta)
Share This Summary 📚
Summarize YouTube Videos and Get Video Transcripts with 1-Click
Try YouTube Summary with ChatGPT & Claude or YouTube Transcript Generator
Explore More Summaries from StatQuest with Josh Starmer 📚


Summarize YouTube Videos and Get Video Transcripts with 1-Click
Try YouTube Summary with ChatGPT & Claude or YouTube Transcript Generator