How to Graph Linear Equations in Slope-Intercept Form

TL;DR
To graph linear equations using slope-intercept form (y = mx + b), identify the y-intercept (b) and slope (m) for each equation. Start by plotting the y-intercept on the graph, and then use the slope to find a second point. Draw the line through these points to complete the graph.
Transcript
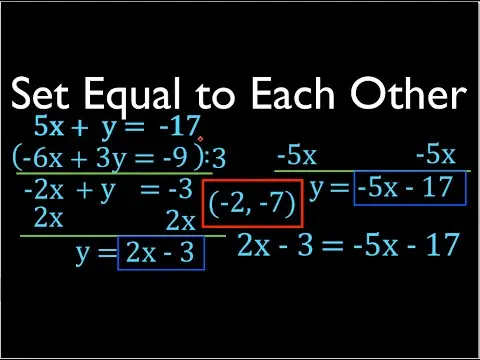
okay in today's video i'm going to show you how to graph the following seven linear equations and this is the situation we have we have our x and y coordinate system the y-axis the x-axis and these are the equations that we're going to graph you will notice that each of the seven equations that we're going to graph are already in the form y equals ... Read More
Key Insights
- 💁♂️ Slope-intercept form (y=mx+b) is essential for graphing linear equations.
- 😵 Y-intercept represents where the line crosses the y-axis.
- 🫥 Slope indicates the line's direction and steepness.
- 🆘 Plotting points using y-intercept and slope helps graph linear equations accurately.
- 😮 Fractional slopes clarify the rise and run movement for graphing.
- 📉 Negative slopes lead to downward sloping lines on the graph.
- 😥 Following a systematic approach of plotting points ensures correct linear equation graphs.
Install to Summarize YouTube Videos and Get Transcripts
Explore YouTube Video Summarizer or Get YouTube Transcript Extractor
Questions & Answers
Q: What is the significance of the y-intercept in graphing linear equations?
The y-intercept is the point where the line crosses the y-axis, crucial for plotting the initial point when graphing linear equations.
Q: How does the slope affect the graph of a linear equation?
The slope determines the direction and steepness of the line; a positive slope goes up and a negative slope goes down, guiding the placement of the second point on the graph.
Q: Why is it important to write down the slope as a fraction when graphing linear equations?
Writing the slope as a fraction, such as rise over run, clarifies the direction and magnitude of the line's movement, aiding in accurate graphing.
Q: What are the key steps to follow when graphing linear equations using slope-intercept form?
The key steps include identifying the y-intercept, determining the slope, plotting the first point at the y-intercept, and then using the slope to find the second point for graphing the line.
Summary & Key Takeaways
-
Tutorial on graphing linear equations in slope-intercept form.
-
Emphasis on identifying y-intercept and slope for graphing.
-
Step-by-step guide to plotting points and drawing lines for linear equations.
Read in Other Languages (beta)
Share This Summary 📚
Summarize YouTube Videos and Get Video Transcripts with 1-Click
Try YouTube Summary with ChatGPT & Claude or YouTube Transcript Generator
Explore More Summaries from Step by Step Science 📚


Summarize YouTube Videos and Get Video Transcripts with 1-Click
Try YouTube Summary with ChatGPT & Claude or YouTube Transcript Generator