How to Arrange Multiple R Graphs Using Patchwork
TL;DR
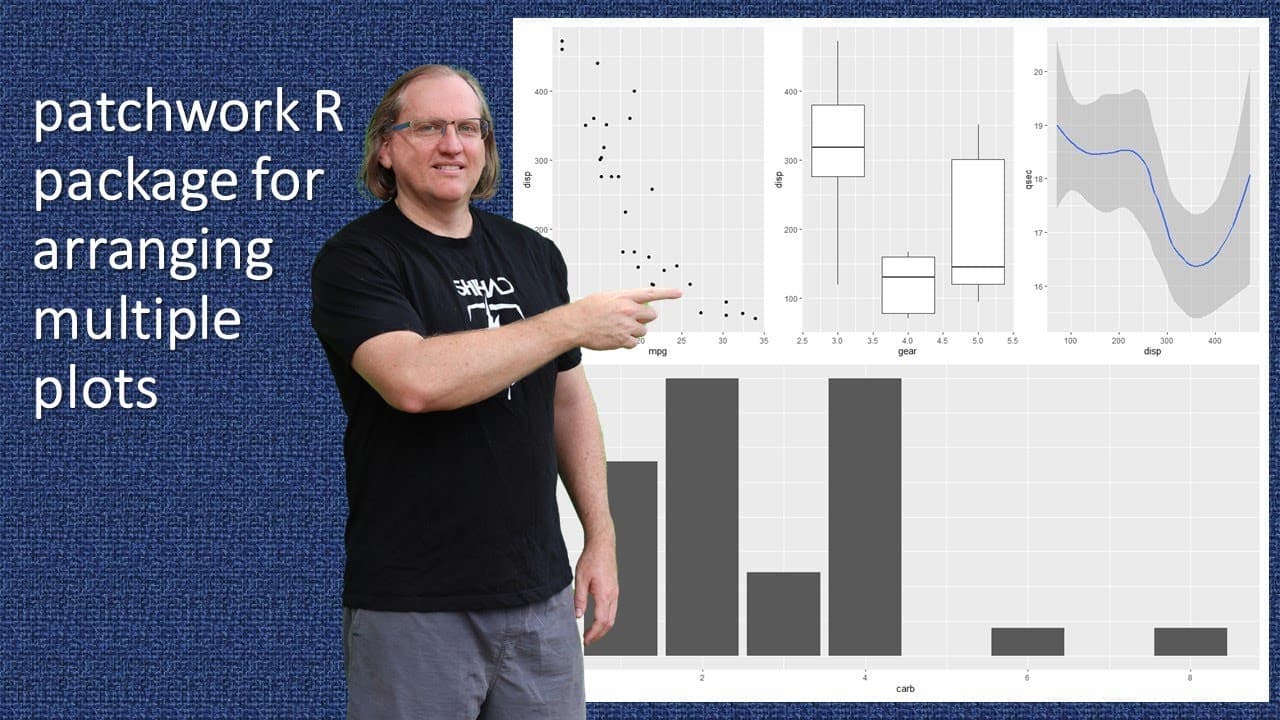
To arrange multiple R graphs flexibly with the Patchwork package, use operators like '+' for side-by-side and '/' for stacking. You can also control widths, heights, and add annotations such as titles and captions for better visual communication. Patchwork allows for embedding plots and combining them with tables, enhancing data presentation.
Transcript
hi friends welcome back to the channel in this video we are going to look at how to use the patchwork package to be able to rearrange multiple graphs within a graphing window so with our gg plot we know that we can use facets to arrange graphs this is a little bit more flexible whilst the examples that i am going to be providing are gg plots we can... Read More
Key Insights
- 📈 Patchwork offers various operators for flexible graph arrangement beyond traditional ggplot facets.
- 👤 Users can control the spacing, width, and height of individual plots in their graphic arrangements.
- 📦 The package facilitates the embedding of plots within one another, enhancing visual storytelling.
- ❓ Annotations for titles and captions can improve the contextual understanding of visual data.
- 👻 Combining graphs with tables in the same visual space allows for comprehensive data presentation.
- 😄 The ease of use and flexibility provided by Patchwork makes it a valuable tool for data visualization in R.
- 👤 Patchwork empowers users to create custom, visually appealing layouts effortlessly, enhancing their presentations.
Install to Summarize YouTube Videos and Get Transcripts
Explore YouTube Video Summarizer or Get YouTube Transcript Extractor
Questions & Answers
Q: What is the primary purpose of the Patchwork package in R?
The Patchwork package allows users to arrange multiple ggplots and other plots more flexibly than traditional methods. It offers various operators, like plus signs for side-by-side arrangements or slashes for stacking graphs, enabling more complex layouts that meet specific visualization needs while effectively communicating data insights.
Q: How can users control the layout of graphs using Patchwork?
Users can control their layouts in Patchwork by using different operators such as the plus sign for side-by-side placements and slashes for vertical stacking. Additionally, using functions like plot_spacer allows for creating spaces between graphs, while width and height parameters let users adjust the size of the columns and rows, enhancing customization in the arrangement.
Q: Can Patchwork accommodate adding titles or annotations to graphs?
Yes, Patchwork enables users to add titles, subtitles, and captions to their arrangements. Utilizing the plot_annotation function, users can create overarching titles for grouped graphs, while annotations can be added to individual plots to clarify and explain each graph's content, improving understanding and communication of data.
Q: How does Patchwork compare to traditional R graphing methods?
Patchwork offers significant advantages over traditional methods like base R plotting or the layout function by providing more intuitive and flexible approaches to arranging multiple plots. With its user-friendly syntax and various operators, Patchwork simplifies the process, allowing users not only to create copious layouts but also to make adjustments on the fly for better presentations.
Summary & Key Takeaways
-
The video introduces the Patchwork package in R, which enhances the flexibility of arranging multiple graphs, surpassing standard ggplot facets.
-
Techniques discussed include plotting side by side, stacking plots, and modifying their widths and heights for tailored presentations.
-
The tutorial also covers adding annotations for titles, subtitles, and combining graphs with tables, enhancing overall visual communication.
Read in Other Languages (beta)
Share This Summary 📚
Summarize YouTube Videos and Get Video Transcripts with 1-Click
Try YouTube Summary with ChatGPT & Claude or YouTube Transcript Generator
Explore More Summaries from Dr Lyndon Walker 📚


Summarize YouTube Videos and Get Video Transcripts with 1-Click
Try YouTube Summary with ChatGPT & Claude or YouTube Transcript Generator