What Key Levels to Watch for Emini Futures Trading?

TL;DR
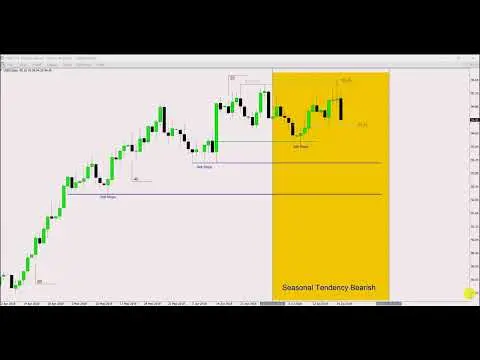
Traders should focus on the fair value gap and the midpoint of the January 9th wick as significant levels on the daily chart of ESH2023. The Fibonacci level at 3982.50 is identified as a crucial target for potential market drops, emphasizing the importance of precise analysis and waiting for clear setups before trading.
Transcript
into London or tomorrow morning the only imbalance is if you look on the daily chart on January 11th Wednesday that big up candle if you look at the candle to the right of it on Thursday January 12th that candle is low and on the candle of January 10th that candles High there's a small little fair value Gap there if we were to drop down and that's ... Read More
Key Insights
- 📡 The content highlights the precision and accuracy of the analysis and signals provided by the algorithm used.
- 💁 The importance of waiting for more information and clear setups before making trading decisions is emphasized.
- 🤩 The analysis showcases the effectiveness of using daily highs and lows, fair value gaps, and Fibonacci levels as key reference points for trading.
Install to Summarize YouTube Videos and Get Transcripts
Explore YouTube Video Summarizer or Get YouTube Transcript Extractor
Questions & Answers
Q: What levels should traders be watching on the daily chart of ESH2023?
Traders should watch the fair value gap and the midpoint of the wick on January 9th as key levels on the daily chart.
Q: What is the significance of the Fibonacci level of 3982.50?
The Fibonacci level of 3982.50 is a potential target for a market drop, and traders should pay attention to price action around this level.
Q: Why does the content emphasize the use of annotations and smaller timeframes?
Annotations and smaller timeframes allow traders to focus on specific levels and patterns for a more detailed analysis and trading decisions.
Q: What is the suggested bias for the market going into the future?
Based on the analysis, the suggested bias is a potential market drop towards the Fibonacci level of 3982.50 and the fair value gap.
Key Insights:
- The content highlights the precision and accuracy of the analysis and signals provided by the algorithm used.
- The importance of waiting for more information and clear setups before making trading decisions is emphasized.
- The analysis showcases the effectiveness of using daily highs and lows, fair value gaps, and Fibonacci levels as key reference points for trading.
- The content addresses the misconceptions about support and resistance levels and highlights the technical science behind the analysis.
Summary & Key Takeaways
-
The daily chart shows a fair value gap and a potential drop towards the midpoint of the wick on January 9th as a significant level to watch.
-
The analysis suggests watching the Fibonacci level of 3982.50 as a target for a potential drop in the market.
-
The content emphasizes the importance of annotations and using smaller timeframes to dig deeper into specific levels and patterns for trading decisions.
Read in Other Languages (beta)
Share This Summary 📚
Summarize YouTube Videos and Get Video Transcripts with 1-Click
Try YouTube Summary with ChatGPT & Claude or YouTube Transcript Generator
Explore More Summaries from The Inner Circle Trader 📚


Summarize YouTube Videos and Get Video Transcripts with 1-Click
Try YouTube Summary with ChatGPT & Claude or YouTube Transcript Generator