How to Use the React Profiler for Debugging Performance Issues

TL;DR
The React Profiler is an essential tool for debugging performance issues after experiencing slow application responses. Key techniques for optimization include understanding the rendering versus committing phases, using React.memo to prevent unnecessary re-renders, and restructuring component hierarchies for efficiency. Focus on feature development first, and address performance only when necessary.
Transcript
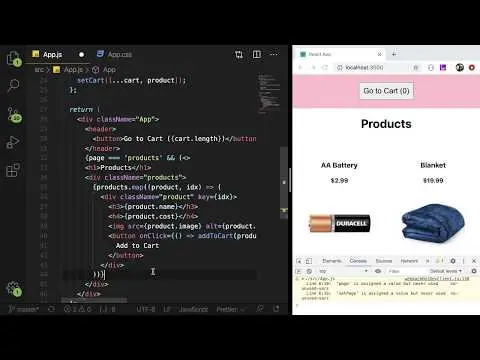
all right how's it going everyone i want to kind of talk a little bit about the react profiler and how you could potentially debug performance issues in your react application now this is a really basic example and i want to say that don't try to fine-tune your react application for efficiency until you actually run to issues where your application... Read More
Key Insights
- 🔨 The React Profiler is a valuable tool for debugging but should be used after an application experiences performance issues, not as a first step in development.
- ❓ Understanding the difference between the rendering and committing phases in React is crucial for effective optimization.
- 💩 Rendering can be quick in React; the real performance hits often come from the DOM update process.
- ❓ React.memo is useful for preventing unwanted re-renders but requires careful implementation to ensure proper function.
- ❓ Developers are encouraged to focus on feature development first and revisit performance optimizations only when necessary.
- 🐢 Real-world tests with throttled CPU performance can help simulate how an application will perform on slower machines.
- 🥺 Avoiding complex optimizations early in development can lead to cleaner, more maintainable code.
Install to Summarize YouTube Videos and Get Transcripts
Explore YouTube Video Summarizer or Get YouTube Transcript Extractor
Questions & Answers
Q: What is the primary purpose of the React Profiler?
The React Profiler is a tool designed to help developers identify performance bottlenecks in their React applications. By monitoring how long components take to render and commit, developers can pinpoint inefficient components or rendering patterns and address them effectively to enhance performance.
Q: Why should developers avoid premature optimization in React apps?
Premature optimization can lead to unnecessary complexity in the code. It's more productive to build features first and observe application performance. Only when real performance issues arise should developers use tools like the React Profiler to diagnose and resolve the problems rather than trying to optimize code from the outset.
Q: How does React handle rendering and committing in components?
Rendering in React involves executing the render function of components when state changes occur, allowing components to prepare their display. The commit phase then updates the actual DOM based on the differences between the virtual DOM and the real DOM, which can be time-intensive and is managed separately to improve performance.
Q: What are some strategies to improve performance in React applications?
Developers can utilize React.memo to prevent unnecessary re-renders of components. Additionally, restructuring components to change their location in the component tree can prevent them from re-rendering without the need for memoization, enhancing efficiency without complicating the codebase.
Summary & Key Takeaways
-
The React Profiler helps identify performance issues but should only be utilized after experiencing slow application responses, rather than preemptively trying to optimize.
-
Rendering in React is typically quick; however, the commit phase, which updates the actual DOM, can introduce delays. Understanding this distinction is crucial for debugging.
-
Techniques such as using React.memo and restructuring component hierarchy can optimize rendering efficiency, ultimately improving application performance.
Read in Other Languages (beta)
Share This Summary 📚
Summarize YouTube Videos and Get Video Transcripts with 1-Click
Try YouTube Summary with ChatGPT & Claude or YouTube Transcript Generator
Explore More Summaries from Web Dev Cody 📚


Summarize YouTube Videos and Get Video Transcripts with 1-Click
Try YouTube Summary with ChatGPT & Claude or YouTube Transcript Generator